Satellites Investigate Irrigation in a Stressed Aquifer
Downloads
- highplains_zoom_lrg.jpg (3507x2480, JPEG)
- highplains_lrg.jpg (2491x2480, JPEG)
Metadata
- Sensor(s):
- Data Date: November 1, 1998 - October 31, 2016
- Visualization Date: July 6, 2018
The High Plains Aquifer, also known as the Ogallala Aquifer, is under stress. Farmers today have to drill ever deeper wells in order to pump water for irrigation, and one recent study found the aquifer to be under more strain than any other in the United States. About 30 percent of the water once stored beneath Kansas is already gone, and another 40 percent will be gone within 50 years if current trends continue.
Nonetheless, pumping continues. Data collected by the MODIS sensors on Aqua and Terra satellites and other sources show that irrigation is increasing in some parts of the aquifer. One study found that 519,000 more hectares were irrigated in 2007 compared to 2002—97 percent of the total added in the United States during that period.
While MODIS can monitor regional trends, it cannot easily examine irrigation patterns at the level of individual fields. “The higher resolution of the sensors on Landsat give us a more nuanced understanding of the annual and seasonal rhythms of irrigation than is possible with MODIS,” explained Jillian Deines, a hydrologist at Michigan State University. Deines and colleagues David Hyndman and Anthony Kendall authored a study in which they compiled nearly two decades of Landsat data to study irrigation trends along the Republican River Basin, which runs through Colorado, Kansas, and Nebraska.
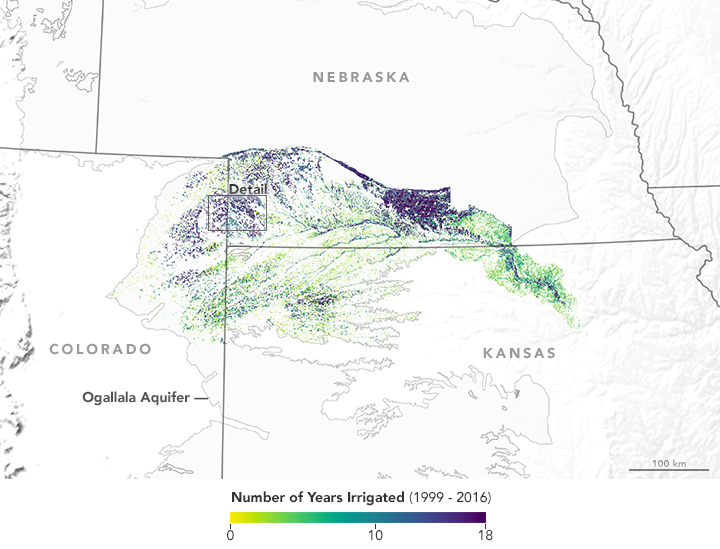
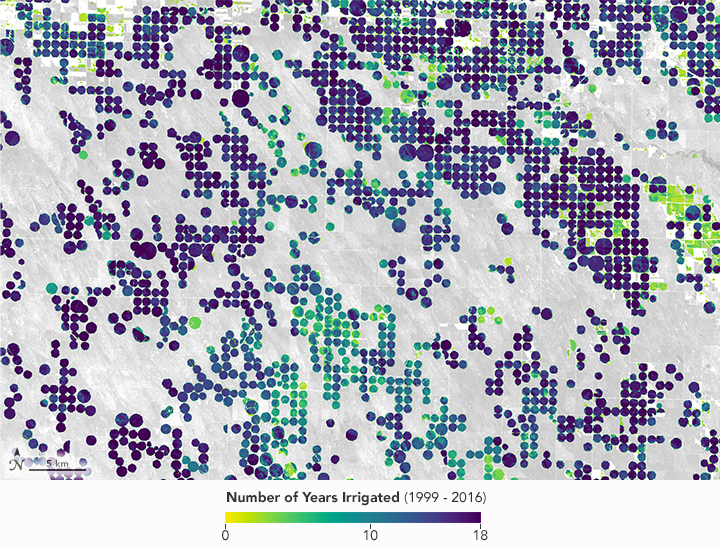
The map at the top of this page shows irrigation frequency in the basin between 1999 and 2016. Areas watered nearly every year are purple; those watered only rarely are yellow. The extent of the Ogallala Aquifer is shown with gray. The second image highlights the variability in irrigation between center-pivot irrigation fields in an area along the Colorado-Nebraska border. The most widely grown crops in the basin are corn and wheat.
Water use in the Republican River Basin is a sensitive issue. While there is a compact in place that details how the states should share water, litigation about water use is common. Given the legal context, Deines says it would be helpful for hydrologists and water managers to have a good understanding of exactly when and where irrigation occurs. Ground-based irrigation statistics tend to be decentralized and of varying quality, so Deines looked to Landsat for a more consistent view.
Examining natural-color and infrared imagery, the team produced high-resolution annual irrigation maps for the entire basin. The maps detail how frequently a field was irrigated, as well as the first and last year it was irrigated.
After analyzing some economic data, Deines and her colleagues believe some of the variability in irrigation they found was driven by crop prices. (Farmers expand irrigation when prices are high to increase yields and profits.) Rainfall also played a role in the variability. “Farmers ended up irrigating more intensely on a smaller number of fields during drought years,” noted Deines.
Landsat also detected an increase in the number of fields irrigated over the study period. Most of the increase was centered on the eastern part of the basin near the Platte and Republican Rivers, an area where irrigation depends more on drawing water from rivers than drilling groundwater from the aquifer.
References and Further Reading
- Brown, J. & Pervez, M. (2014) Merging remote sensing data and national agricultural statistics to model change in irrigated agriculture. Agricultural Systems 127, 28-40.
- Deines, J. & Kendall, A., Hyndman, D. (2017) Annual Irrigation Dynamics in the U.S. Northern High Plains Derived from Landsat Satellite Data. Geophysical Research Letters, 44 (18), 9350-9360.
- National Geographic (2016) A Vanishing Aquifer. Accessed July 5, 2018.
- Scientific American (2009) The Ogallala Aquifer: Saving a Vital U.S. Water Source. Accessed July 5, 2018.
- Steward, D. et al. (2013) Tapping unsustainable groundwater stores for agricultural production in the High Plains Aquifer of Kansas, projections to 2110. PNAS.
- Richey, A. et al. (2015) Quantifying renewable groundwater stress with GRACE. Water Resources Research 51 (7).
NASA Earth Observatory maps by Lauren Dauphin, using data from Deines, Jillian, et al. (2017). Story by Adam Voiland.
This image record originally appeared on the Earth Observatory. Click here to view the full, original record.
