A Manmade Volcano over Norilsk
Downloads
- norilsk_omp_2017193.jpg (720x545, JPEG)
- norilsk_oli_2017193_lrg.jpg (6756x4504, JPEG)
Metadata
- Sensor(s):
- Suomi NPP - OMPS
- Landsat 8 - OLI
- Data Date: July 12, 2017
- Visualization Date: June 7, 2018
In global satellite observations of sulfur dioxide (SO2), several sources of the polluting gas stand out. Dozens of volcanoes spit out plumes of it during explosive and effusive eruptions; the gas also seeps more or less continuously from dozens of other volcanoes that are not actively erupting in a process scientists call passive degassing. And nearly 300 coal-fired powered plants, dozens of gas and oil sites, and more than 50 smelting facilities emit streams of sulfur dioxide large enough to be detected from space.
But of all the manmade (anthropogenic) sources, one location really sticks out: Norilsk. This industrial city of 175,000 people in northern Siberia has several mines that tap into one of the largest nickel, copper, platinum, and palladium deposits on Earth. And all of the smelting—the extraction of usable metal from ore by grinding it up and melting it—that happens there has made it into one of the largest sources of sulfur dioxide detectable by satellites.
The Ozone Mapping Profiler Suite (OMPS) on the Suomi NPP satellite acquired the data for the map above of sulfur dioxide concentrations around the city on July 12, 2017. The map shows the gas observed in the boundary layer, the lowest part of the atmosphere. Emissions on this day were typical for a June summer day, maxing out at roughly 4 Dobson Units.
Several teams of scientists have scrutinized Norilsk’s sulfur dioxide cloud because it is so extreme. “It is almost double the size of the next largest anthropogenic source,” said Chris McLinden, an atmospheric scientist with Environment and Climate Change Canada. “In fact, Norlisk’s emissions are more comparable to the passive degassing that happens at some of the most active effusive volcanoes. Between 2005 and 2017, only one volcano—Ambrym in Vanuatu—emitted more sulfur dioxide through passive degassing than Norilsk.”
Several research teams have quantified the sulfur dioxide emissions from Norilsk. One recent study based on Ozone Monitoring Instrument (OMI) data put the number between 1700 and 2300 metric kilotons (kT) per year. A separate estimate based on aircraft measurements tallied 1000 kT per year.
Whatever the number, none of the scientists who study Norilsk doubt that it is a lot of sulfur dioxide. Several researchers have documented widespread degradation of the forests surrounding Norilsk because of regular exposure to high levels of the gas. Sulfur dioxide causes the pores on leaves (stomata) to open up too much, resulting in the loss of water. Over time, leaves become bleached or discolored, and trees or other plants can become stunted or die as they struggle to generate energy through photosynthesis.
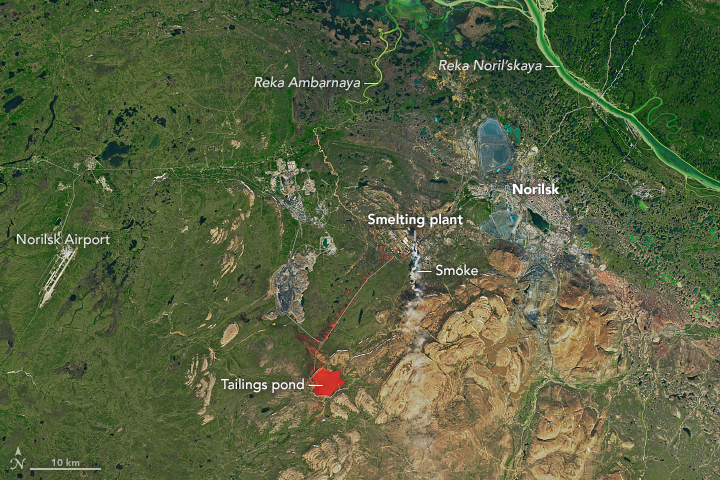
In the natural-color image above, browning vegetation around the city is visible northwest and southeast of the city. A bright pollution plume rich with sulfur dioxide drifted from a large smelting facility southwest of the city. The red color of the water of the tailings pond likely relates to nearby mining or smelting activities. The image was acquired on July 12, 2017, by the Operational Land Imager (OLI) on Landsat 8.
Sulfur dioxide emissions have been intense at Norilsk for decades. The city began producing nickel and other metals in the 1940s. Satellites have closely monitored its sulfur dioxide emissions since the Aura satellite was launched in 2004. Since then, emissions from Norilsk have not changed much, even as other major smelting sites in Peru and Kazakhstan saw significant declines in sulfur dioxide thanks to modernization projects.
There are signs that the days of large sulfur dioxide clouds hanging over the city may be numbered. Mine operators have described an ambitious plan to modernize equipment and potentially reduce sulfur dioxide emissions by 75 percent by 2023.
References and Further Reading
- Bellona (2017, December 20) Norilsk Nickel offers a sketch of how it will reduce its sulfur dioxide pollution. Accessed June 6, 2018.
- Bauduin, S. et al. (2014) IASI observations of sulfur dioxide (SO2) in the boundary layer of Norilsk. Journal of Geophysical Research Atmosphere, (119), 7, 4253-4263.
- Calvert Journal (2017, November 8) Extreme cold? Check. Acid rain? Check. So why do locals love the Arctic city of Norilsk? Accessed June 6, 2018.
- Fioletov, V. et al. (2016) A global catalogue of large SO2 sources and emissions derived from the Ozone Monitoring Instrument. Atmos. Chem. Phys. 16, 1147-11519.
- Norilsk Mining Centre Norilsk Mining Centre. Accessed June 6, 2018.
- The Atlantic (2017, November 8) A Toxic, Closed-Off City on the Edge of the World. Accessed June 6, 2018.
- The New York Times (2017, November 8) The Lure of a Better Life, Amid Cold and Darkness. Accessed June 6, 2018.
- Walter, D. et al. (2912) Flux calculation using CARIBIC DOAS aircraft measurements: SO2emission of Norilsk. Journal of Geophysical Research Atmosphere, (119), 7, 4253-4263.
NASA Earth Observatory images by Joshua Stevens, using Landsat data from the U.S. Geological Survey and OMPS data from the Goddard Earth Sciences Data and Information Services Center (GES DISC). Story by Adam Voiland.
This image record originally appeared on the Earth Observatory. Click here to view the full, original record.
