Climate Proofing Rio de Janeiro
Downloads
- rio_tir_2016239_lrg.png (2712x1784, PNG)
- rio_oli_2016239_lrg.png (2712x1784, PNG)
- rio_lst_1984-2016.png (720x545, PNG)
Metadata
- Sensor(s):
- Landsat 8 - TIRS
- Landsat 8 - OLI
- Data Date:
- Visualization Date: August 2, 2017
Situated in the tropics, Rio de Janeiro has always had a pretty warm climate. But lately the thermometer has been going up more than down in Brazil’s second largest city. Hot days have grown more frequent, cold days less so, and heat waves last longer.
According to a climate change adaptation report from the city government, average air temperatures in Rio have increased by about 0.05 degrees Celsius per year in recent decades. As part of a partnership with NASA’s Earth Science Division, city leaders are working to better understand and adapt to the heat. Planners are using publicly available temperature data from NASA satellites to help devise ways of “climate-proofing” the city from rising temperatures and natural disasters.
Though global warming is a factor in Rio’s rising air temperatures, urban expansion is at least partly responsible. Between 1960 and 2015, Rio’s greater metropolitan area grew by roughly 7 million people and has seen development spread into areas that used to be rural or forested. Since common building materials like asphalt, steel, concrete, and brick retain more heat than vegetation, land development elevates surface and, to a lesser degree, air temperatures. Meanwhile, the vehicles, factories, and air conditioning units that come with urbanization pump even more heat into the urban atmosphere.
Researchers refer to the anomalously warm temperatures in cities as “urban heat islands.” While there are few detailed studies of Rio’s atmospheric heat island, satellite observations show that the city’s warmest neighborhoods see land surface temperatures as much as 20°C (36°F) higher than in less developed surrounding areas, said Andrews Lucena, a scientist at the Federal Rural University of Rio de Janeiro. (Note: a 20°C increase in surface temperatures does not directly translate to a large increase in air temperatures. Atmospheric heat islands are generally much less pronounced: a few degrees difference at night between urban air temperatures and surrounding rural areas.)
Analyzing more than 90 Landsat scenes tracking the city’s surface temperatures over several decades, Lucena has shown that Rio’s surface heat island has intensified, increasing by an average of 4.4 to 6.1°C during the past decade.
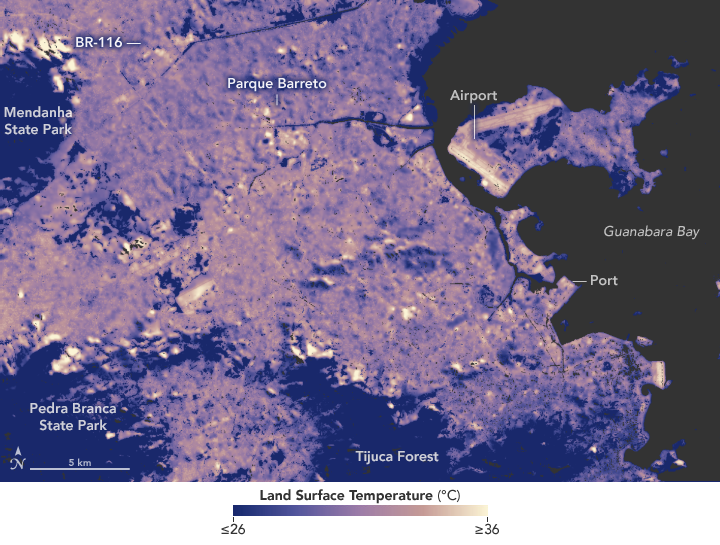
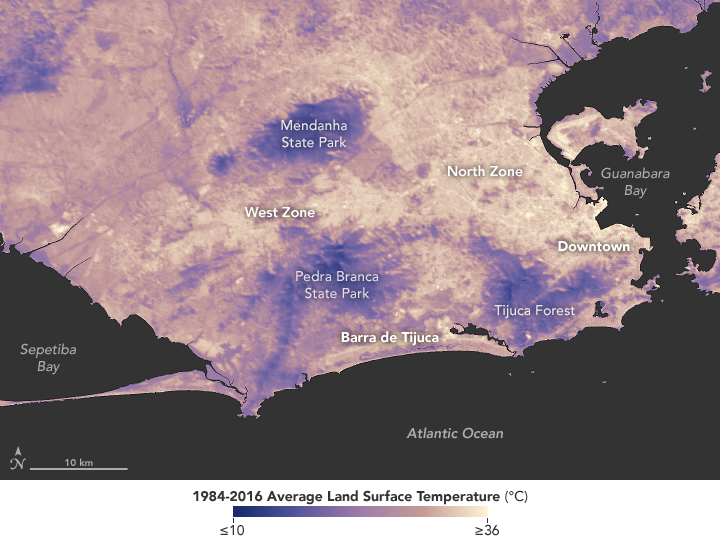
The map at the top of this page shows surface temperatures in Rio’s North Zone on August 26, 2016. The measurements are derived from observations made by the Thermal Infrared Sensor (TIRS) and Operational Land Imager (OLI) on Landsat 8. The coolest areas are blue and light purple; warmer areas are pink and white. The second map shows where impervious surfaces—buildings and roads that are impenetrable to water—are concentrated. Blue areas have lots of impervious surfaces; white areas have few. The third map (below) shows average land surface temperatures over a broader area as observed by Landsat 5, 7, and 8 between 1984–2016.

Use the image-comparison tool to see how development generally elevates land surface temperatures. For instance, the airport, seaport, and highways all stand out as hot spots. Notice that Tijuca Forest, Mendanha State Park, and Pedra Branca State Park—all forested mountainous areas—are cool in comparison to the heavily developed neighborhoods along the coast of Guanabara Bay. Neighborhoods in the West Zone between Pedra Branca and Mendanha—most notably Bangu—have some of the hottest temperatures in Rio. Many homes in this area have thin, corrugated sheet metal roofs, which heat up more easily than other building materials.
Geography also contributes to the heating. Hot air tends to get trapped between the two mountain and causes hot, dry foehn winds to flow into the valley. Pedra Branca also blocks sea breezes from reaching this area. In general, the crowded inland neighborhood in Rio’s North and West Zones are warmer than wealthier coastal communities, such as Ipanema and Jardim Botânico, which have more trees and cool sea breezes.
Model projections show that surface and air temperatures will continue to rise in coming decades, so planners in Rio’s government are looking for ways to offset heat-island effects. The city is considering where green infrastructure—such as tree plantings and green and white roofs—could have the most impact.
According to Felipe Mandarino of Rio’s Pereira Passos Institute, the city intends to plant more than 120,000 new saplings, expand the city’s protected green spaces by 4,000 hectares, and revamp hundreds of public squares to make them less prone to heating by 2020. Public squares in the North Zone are a particular target because of the intensity of the heat island in that area.
Note that the maps on this page show land surface temperatures, not air temperatures. Land surface temperatures reflect how hot the surface of the Earth would feel to the touch in a particular location. They are usually significantly hotter or cooler than air temperatures. (To learn more, read: Where is the Hottest Place on Earth?)
“We have a good understanding of how much something like a green roof or a white roof can affect land surface temperatures,” said Stuart Gaffin, a scientist at Columbia University and the NASA Goddard Institute for Space Studies. “What is less understood is how large-scale green infrastructure projects affect air temperatures, which is what people actually feel.”
Iain Stewart, an expert on heat islands from the University of Toronto, underscored this point. “It is important to remember that surface heat islands are measured by only those city surfaces that can be ‘seen’ by the radiometer on the satellite,” he said. “In a compact city, building rooftops dominate satellite images of surface heat. During the day, rooftops tend to be very hot; at night they are cold, resulting in extreme daily temperature ranges. Air temperatures, in contrast, behave more conservatively, so one has to be careful when extrapolating the thermal effects of surface heat islands to the atmosphere. The processes that generate surface and atmospheric heat islands, though related, are different.”
References
- Dereczynski, C. et al. (2013) Detection and Projections of Climate Change in Rio de Janeiro, Brazil. Detection and Projections of Climate Change in Rio de Janeiro, Brazil. Scientific Research, 2 (1).
- EOS (2017, July 18) Cities Partner to Prepare for Natural Hazards and Climate Change. Accessed August 3, 2017.
- Filho, E.M. et al. (2009) Rio de Janeiro’s Tropical Urban Climate. International Association for Urban Climate, 32.
- Lucena, J.A. et al. (2015) Estimation of the urban heat island in the Metropolitan Area of Rio de Janeiro - Brazil. Urban Remote Sensing Event.
- Lucena, J.A. et al. (2012) Urban climate and clues of heat island events in the metropolitan area of Rio de Janeiro. Theoretical and Applied Climatology, 111, 3-4.
- NASA NASA-Rio de Janeiro Partnership. Accessed August 3, 2017.
- NASA Global Climate Change (2016, November 15) From NYC to Rio: NASA helps cities address climate risks. Accessed August 3, 2017.
- Pereira Passos Institute Mudanças Climáticas e as Ilhas de Calor. Accessed August 3, 2017.
- Rio de Janeiro (2016) Climate Change Adaption Strategy for the City of Rio de Janeiro. Accessed August 3, 2017.
NASA Earth Observatory images by Joshua Stevens, using Landsat data from the U.S. Geological Survey, and annual average data courtesy of Andrews Lucena, Federal Rural University of Rio de Janeiro. Story by Adam Voiland.
This image record originally appeared on the Earth Observatory. Click here to view the full, original record.