A Crack of Light in the Polar Dark
Downloads
- larsenc_tir_2017170_lrg.jpg (4800x6400, JPEG)
- larsenc_tir_2017170.jpg (720x597, JPEG)
- larsenc_sar_2017179_lrg.jpg (5934x3956, JPEG)
- larsenc_locator_2017179.png (720x480, PNG)
Metadata
- Sensor(s):
- Landsat 8 - TIRS
- Data Date: June 17, 2017
- Visualization Date: June 28, 2017

Throughout the sunlit months of late 2016 and early 2017, scientists watched closely as a crack grew across the Larsen C ice shelf on the Antarctic Peninsula. The rift, which threatens to create one of the largest icebergs ever recorded, was visible throughout austral summer in natural-color satellite imagery and in aerial photographs.
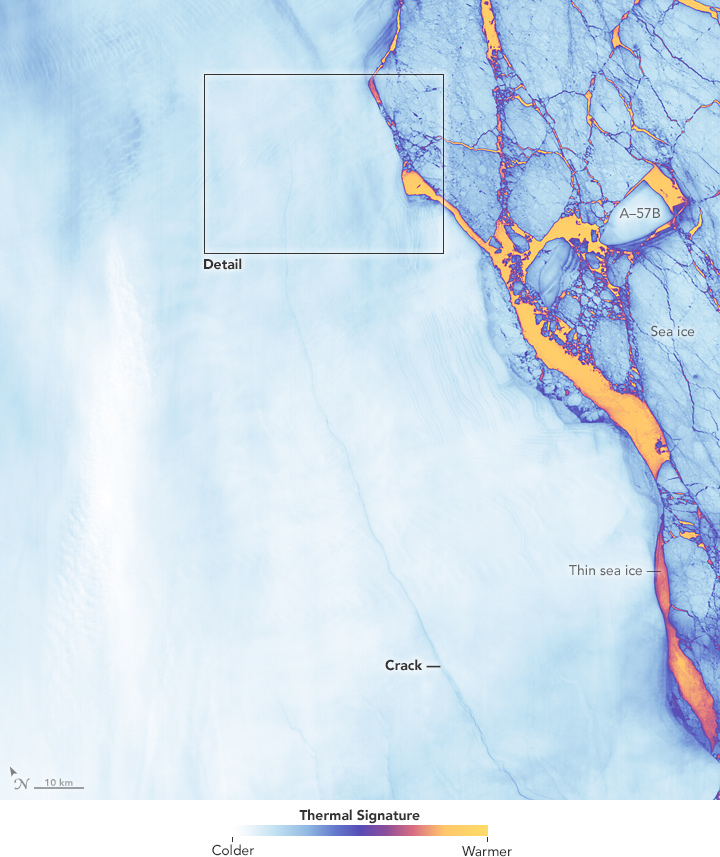
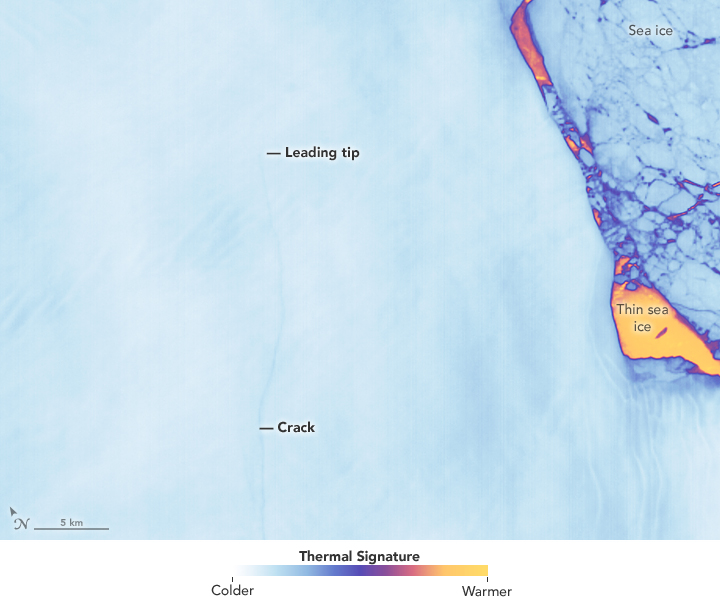
Now the crack is shrouded in winter darkness again. But even in the dark, there are satellite instruments that allow scientists to “see” the rift. On June 17, 2017, the Thermal Infrared Sensor (TIRS) on Landsat 8 captured a false-color image of the crack and the surrounding ice shelf. It shows the relative warmth or coolness of the landscape. Orange depicts where the surface is the warmest, most notably the areas of open ocean and of water topped by thin sea ice. Light blues and whites are the coldest areas, spanning most of the ice shelf and some areas of sea ice. Dark blue and purple areas are in the mid-range.
The blue hue of the crack indicates that relatively warm ocean water is not far below the ice surface. No part of the crack appears as warm as ocean areas, likely because there is a soup of floating, broken ice pieces from the rift’s walls and bits of sea ice sitting atop the water-filled crack. (This mixture can act as a weak glue, but it also prevents the rift from healing.)

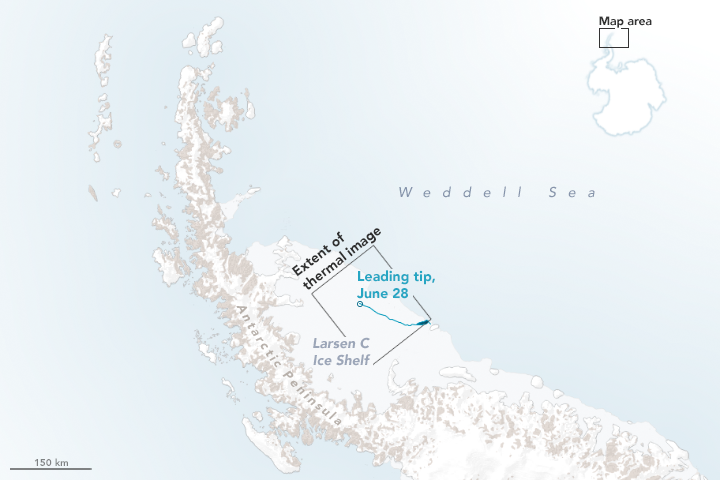
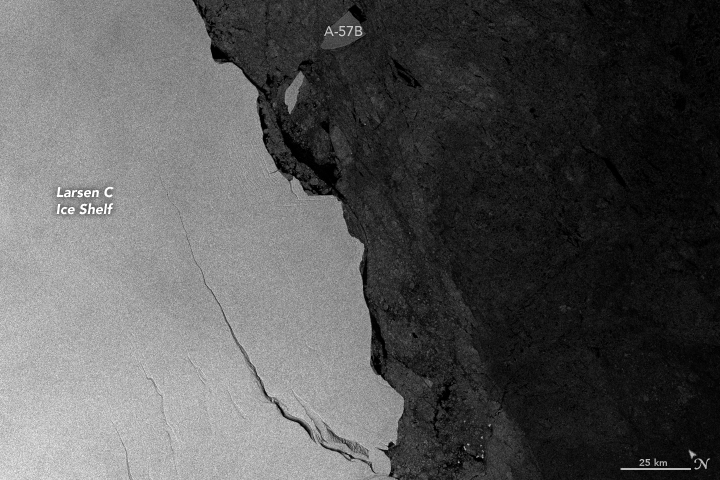
As of May 31, 2017, the tip of the crack was just 13 kilometers (8 miles) from the ice front. Then between June 24-27, the speed of rift growth tripled. These numbers were calculated by scientists with the UK-based Project MIDAS, who have been monitoring the rift by radar through the winter. The synthetic aperture radar (SAR) on the Sentinel-1A satellite captured an image (below) of the crack on June 28, 2017.
The ice near the leading edge, or tip, of the rift is being weakened by winds that generally blow from the west. These winds interact with the surface texture of the shelf and push it eastward. The oscillations of tides and the pull of the Weddell Gyre (ocean currents) add to the stress on the weakening ice shelf.
It’s not possible to say when the shelf will calve ice or break up. According to Project MIDAS, it could be “hours, days or weeks,” but the recent acceleration marks a “notable departure from previous observations.”
References and Further Reading
- Project MIDAS (2017, June 28) Impact of Melt on Ice Shelf Dynamics and Stability. Accessed June 28, 2017.
- U.S. National Ice Center (2017, June 27) Current Daily Ice Analysis. Accessed June 28, 2017.
NASA Earth Observatory images by Joshua Stevens and Jesse Allen, using Landsat data from the U.S. Geological Survey and modified Copernicus Sentinel data (2017) processed by the European Space Agency. Story by Kathryn Hansen with image interpretation by Christopher Shuman/UMBC JCET/NASA’s Goddard Space Flight Center.
This image record originally appeared on the Earth Observatory. Click here to view the full, original record.
