
Tuscaloosa Tornado Track Fades
Downloads
- tuscaloosa_tm5_2011148_lrg.jpg (6000x6000, JPEG)
- tuscaloosa_tm5_2011148_geo.tif (6000x6000, GeoTIFF)
- tuscaloosa_oli_2016114_lrg.jpg (6000x6000, JPEG)
- tuscaloosa_oli_2016114_geo.tif (6000x6000, GeoTIFF)
Metadata
- Sensor(s):
- Landsat 5 - TM
- Landsat 8 - OLI
- Data Date:
- Visualization Date: May 2, 2016
Three-hundred sixty-three tornadoes raked across the southern, midwestern, and northeastern United States between April 25 and April 28, 2011. The extraordinary event proved to be the largest and costliest outbreak of tornadoes ever recorded in the United States. When the dust settled, authorities blamed the storms for the deaths of 348 people and $11 billion of damage.
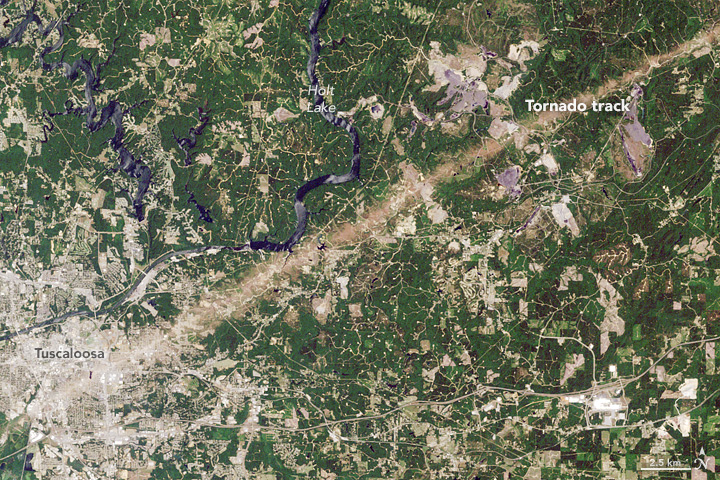
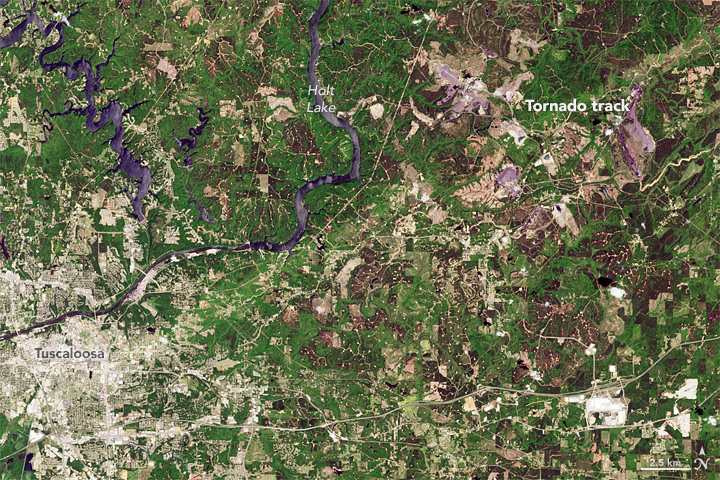
About a month after the tornado outbreak, the Thematic Mapper on Landsat 5 captured this image (top) of a damage track cutting through Tuscaloosa, Alabama. Meteorologists estimate that the tornado that caused it was an EF-4, meaning it had wind speeds between 166 and 200 miles (267 and 321 kilometers) per hour. At its widest point, the damage track was about 1.5 miles (2.5 kilometers) wide. As seen in the lower image, which was acquired by the Operational Land Imager (OLI), much of the vegetation had recovered five years later, but signs of the damage track were still visible. Turn on the image comparison tool to see the changes.
Confusion can reign in the first few days after a major natural disaster strikes. Information tends to be scarce, the extent of damage is not always clear, and first responders and damage assessment teams have to make tough decisions about where to focus their efforts first. After the April 2011 tornado outbreak, the desire to get reliable information about the scope of the disaster out to meteorologists and the public as quickly as possible prompted scientists who were part of the Short-term Prediction Research and Transition Center (SPoRT) team based at Marshall Space Flight Center to swing into action. Though the storms initially knocked out power at Marshall, the scientists analyzed all available satellite data for evidence of tornado damage when power was restored.
They considered several types of satellite data, including images captured by sensors on the Aqua, Terra, and Landsat satellites. Damage tracks were most visible in medium-resolution (15 to 30 meter per pixel) imagery collected by the Advanced Spaceborne Thermal Emission and Reflection Radiometer (ASTER) and Thematic Mapper (TM) sensors. The widest tracks were also visible in the lower-resolution (250 meters per pixel) Moderate Resolution Imaging Spectroradiometer (MODIS) imagery. Damage tracks were easiest to pinpoint in Normalized Difference Vegetation Index (NDVI) imagery; NDVI is measure of plant health that based on how much visible and near-infrared light plants reflect.
The most intense tornadoes (EF-3 or greater) were the easiest to identify as they generally produce longer tracks, wider tracks, and more damage than weaker tornadoes. Damage tracks were also easier to identify in uniformly vegetated areas such as cornfields or forests and more difficult to detect in towns and cities where land surfaces are more varied and have less vegetation.
“In regards to damage assessment, the satellite products supplement ‘boots on the ground’ surveys performed by the National Weather Service,” explained Andrew Molthan, a member of the SPoRT team and a meteorologist at Marshall. “These damage tracks are not used to estimate the intensity of a given tornado; however, they can help to identify opportunities for forecasters to adjust a ground survey based upon the imagery, particularly in areas that were difficult to access due to road network limitations or other damage and obstructions.”
The 2011 tornado outbreak proved to be just the first foray into tornado damage assessment for the SPoRT team. Since then, the group has received funding to expand its efforts beyond northern Alabama, and the team now collaborates with and provides satellite imagery to meteorologists at several National Weather Service offices. “We are also looking to extend the application of imagery to other severe weather hazards such as damaging hail and straightline winds, which we think will be particularly helpful in the Midwest during summer growing season months where damage scars are readily and frequently seen in an otherwise uniformly green area of corn and other agriculture,” noted Molthan.
View a suite of data products related to the 2011 tornado outbreak produced by the SPoRT team here.
-
References
- Cole, T. et al. (2014) Using Satellite Imagery to Identify Tornado Damage Tracks and Recovery from the April 27, 2011 Severe Weather Outbreak. NASA Technical Reports Server. Accessed May 4, 2016.
- Molthan, A. et al. (2011, October 4) NASA satellite data assist in tornado damage assessments. EOS Transactions (92) 40, 337-339.
- NASA Earth Observatory (2011) Severe Tornado Outbreak in the Southern United States.
- NOAA (2011, May 4) April 2011 tornado information. Accessed May 5, 2011.
- The Wide World of SPoRT (2011, April 27) April 27, 2011–Five Years Later: A Satellite Imagery Perspective. Accessed May 4, 2016.
NASA Earth Observatory imagse by Jesse Allen, using Landsat data from the U.S. Geological Survey. Caption by Adam Voiland.
This image record originally appeared on the Earth Observatory. Click here to view the full, original record.