
Satellite Data Helps Migrating Birds
Downloads
- sandpiper_gis_2000158_lrg.png (1821x1214, PNG)
- sandpiper_gis_2000242_lrg.png (1821x1214, PNG)
Metadata
- Sensor(s):
- Data Date:
- Visualization Date: September 24, 2015
This fall, birds migrating south from the Arctic will find 7,000 acres of new, temporary wetland habitat for their stopovers in California. These wetlands—rice fields shallowly flooded for a couple weeks—are courtesy of a project that combines citizen science, conservation groups, and imagery from Landsat satellites.
The BirdReturns program is an effort to provide “pop-up habitats” for some of the millions of shorebirds (such as sandpipers and plovers) that migrate each year from summer breeding grounds in Alaska and Canada to winter habitats in California, Mexico, and Central and South America. The birds move along the “Pacific Flyway,” where they seek out increasingly rare wetlands teeming with tasty insects to fuel their long-distance flights.
The problem is that more than 90 percent of the natural wetlands in the Central Valley of California have been lost to development, agriculture, and other land-use changes, according to Mark Reynolds, lead scientist for The Nature Conservancy’s California migratory bird program. “How do you help wildlife that move around and create habitat in places that may only be important for a few weeks or a few months out of the year?” Reynolds said. “We had long been searching for spatial data that could help us.”
The solution involves big data, binoculars, and rice paddies. It includes partners from The Nature Conservancy, Point Blue Conservation Science, and the Cornell Lab of Ornithology.
For several years, the Cornell Lab of Ornithology has organized the eBird program, which collects on-the-ground observations (including species and date spotted) from bird watchers nationwide. With a recent NASA grant to Cornell, scientists created computer models to analyze that eBird data and combine it with remote sensing imagery from Landsat and the Moderate Resolution Imaging Spectroradiometer (MODIS) instruments on NASA’s Terra and Aqua satellites. With these models, they could identify areas in the Central Valley where birds flocked during the spring and fall migrations, and they could estimate the number of birds making the journey.
“The challenge then was to better understand the status of the habitat, where the models were predicting we should have birds,” Reynolds said.
He turned to Matthew Reiter, a quantitative ecologist with the conservation group Point Blue, who had been using Landsat imagery to look at where and when there was standing water, a good indicator of where to find shorebirds. For the BirdReturns project, the team analyzed 1,500 Landsat scenes acquired between 2000 to 2011 (Landsat 5 and 7) and 2013–14 (Landsat 8) to determine the seasonal location of surface water.
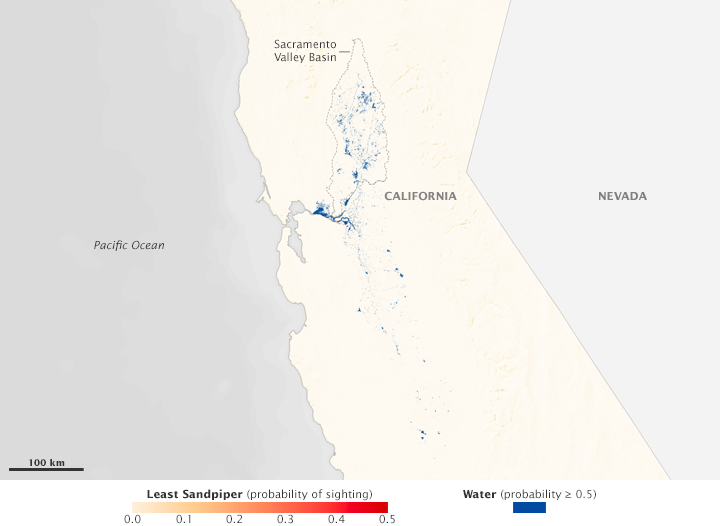
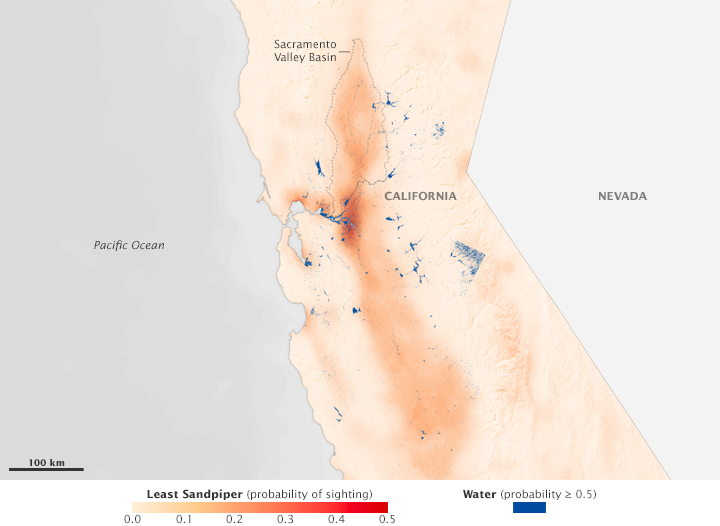
“We can show patterns of how there is changing habitat availability through the year, and that the timing may vary year to year,” Reiter said. Matching the location and timing of surface water with the route and timing of migrating shorebirds, the BirdReturns program looks for those key sites where extra water could make a difference for birds that forage in wetlands. The maps at the top of this page represent some of the output of those models. Each map shows the location and abundance of water-filled areas and of least sandpipers in early June and late August.
That’s where farmers come in. Rice farmers in California’s Central Valley usually flood their fields after the harvest in order to soften the stubble and make it easier to clear for the next year. Through BirdReturns, farmers submit bids to The Nature Conservancy stating how much money per acre it would take for them to flood their fields for a few weeks to create these shallow, pop-up wetland habitats. The team examines the bids, compares them to the priority habitats, and then pays farmers to flood fields for specific two-week periods.
For autumn 2015, thirty farmers applied water on approximately 7,000 acres of rice fields. (About 30,000 acres of cumulative habitat was created through auctions in spring 2014, autumn 2014, and spring 2015.) In spring 2014, the group surveyed the participating fields, as well as control fields that were dry. They found that more than 180,000 birds from more than 50 species used the 10,000 acres of pop-up wetlands—30 times more than were counted on the dry fields.
“It has been a pretty astonishing success,” Reynolds said. “Farmers participated, and we were able to put habitat out there at a fraction of the cost to purchase that land or put an easement on it.”
With the ongoing drought in California drying up some of the state’s wildlife refuges, it is even more valuable to have a program like this, he said. If farmers have the water to create the habitat, it could compensate for dry areas elsewhere along the route.
The freely available satellite imagery from Landsat, MODIS, and other satellite instruments are invaluable resources to see how birds and other animals are affected by landscape changes, Reiter said. “With applied conservation programs, we are using that imagery to say here are the areas that we can prioritize for conservation management, and here are areas that maybe we can let go. It’s a very powerful tool for conservation.”
NASA Earth Observatory images by Joshua Stevens based on water data from Point Blue and the Nature Conservancy, and bird data from the Cornell Lab of Ornithology. Caption by Kate Ramsayer, NASA Goddard Space Flight Center.
This image record originally appeared on the Earth Observatory. Click here to view the full, original record.