Blooms off Both North American Coasts
Downloads
- njalgae_oli_2015215_lrg.jpg (4775x4295, JPEG)
- njalgae_oli_2015215.jpg (720x480, JPEG)
- westcoast_oli_2015197_lrg.jpg (13591x28969, JPEG)
Metadata
- Sensor(s):
- Landsat 8 - OLI
- Data Date: August 3, 2015
- Visualization Date: August 7, 2015
Phytoplankton are to the ocean what grasses and other ground cover are to land: the primary producers, the basic food source and carbon recycler for the rest of the environment. Algae and other forms of phytoplankton are floating, plant-like organisms that soak up sunshine, sponge up nutrients, and create their own food (energy).
The cycle of phytoplankton growth goes on continuously in the ocean, but when conditions are right, the growth of microscopic phytoplankton can blossom to scales that are visible from space for days to weeks. Much of the time, these massive blooms are benign, a boon for marine animals from zooplankton to fish to whales who consume the phytoplankton or consume the consumers. Other times, prodigious phytoplankton growth can be toxic to an ecosystem, suffocating marine life (by depleting the oxygen in the sea) or producing toxins that can sicken and sometimes kill the creatures (including humans) who ingest them.
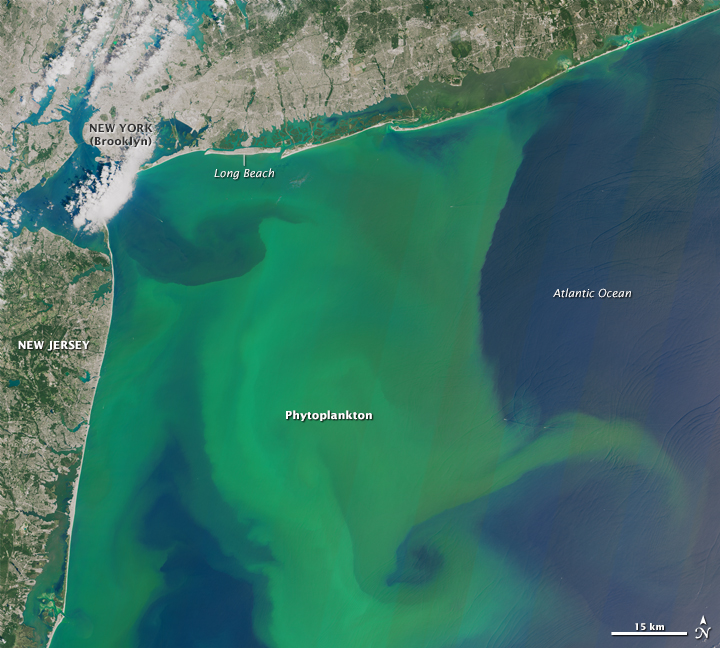
Such was the case in early August 2015, when blooms formed off the Atlantic (above) and Pacific (below) coasts of the United States.
Offshore from New Jersey and New York, a vast, seemingly benign bloom of phytoplankton gave the Atlantic Ocean a chalky green color. On August 3, the Operational Land Imager (OLI) on the Landsat 8 satellite observed the scene (above) off the coast of New Jersey and New York, in an area referred to by oceanographers and geologists as the New York Bight.
The bloom was likely caused by coastal upwelling, according to Oscar Schofield, a marine scientist at Rutgers University. Upwelling is a process by which winds blow surface waters away from the coast, causing deeper, cooler, and often nutrient-rich waters to well up from the depths to fill the gap. Persistent westerly or southerly breezes can lead to upwelling along the Mid-Atlantic coast.
Karen Chytalo, a biologist with the New York State Department of Environmental Conservation, noted that roughly 1.7 billion gallons of treated sewage is discharged to the ocean every day through the inlet between Sandy Hook, New Jersey, and Rockaway, New York (under a cloud in the image). That nutrient-rich water could also be contributing to the bloom.
“These events in summer are not unprecedented,” said Chris Gobler, a coastal ecologist at Stony Brook University. “While blooms and associated hypoxia were common in the New York Bight in the 1970s due to ocean dumping, a ban on this made these event rarer. Those blooms were often caused by the dinoflagellate Ceratium. The type of algae causing this event now is unknown, although I would suspect diatoms.”
The scene was less benign off the West Coast of the United States and Canada. Phytoplankton have been abundant in northeastern Pacific waters for months, and several of the species have been toxic. The composite image above was assembled from five scenes acquired on July 16, 2015, by Landsat 8. (A more recent Landsat 8 pass on August 1 was too cloudy to show much of the bloom.) The composite shows coastal waters from central Washington to the Oregon–California border, with swirling patterns of green showing the locations of blooms.
Marine biologists have reported blooms from Alaska to southern California this summer. They have been concerned to find substantial populations of Pseudo-nitzschia, a genus of diatoms that produces domoic acid. Once concentrated in the flesh of shellfish and crabs, this neurotoxin can lead to amnesic shellfish poisoning in humans. The prevalance of Pseudo-nitzschia has led coastal agencies in Washington, Oregon, and California to closely monitor and, in some cases, close crab, clam, sardine, and anchovy fisheries.
According to Tom Yulsman of Discover magazine, the blooms along the Pacific Coast have been linked to deaths of whales, sea lions, and sea birds. The blooms might be related to the mass of warm water and air that has persisted over the northeast Pacific for months.
References
- Associated Press (2015, August 4) Toxic algae blooming in warm water from California to Alaska. Accessed August 7, 2015.
- ImaGeo Blog, via Discover magazine (2015, August 6) Record Algae Bloom Laced with Toxins is Flourishing in “The Blob.” Accessed August 7, 2015.
- NASA Earth Observatory (2015, April 18) Warm Water and Strange Weather May Be Connected.
- NASA Earth Observatory (2010, July 13) What are Phytoplankton?
NASA Earth Observatory images by Joshua Stevens, using Landsat data from the U.S. Geological Survey. Caption by Mike Carlowicz. Thanks to Don Anderson (WHOI), Oscar Schofield (Rutgers), Karen Chytalo (NY DEC), and Chris Gobler (Stony Brook University) for image interpretation.
This image record originally appeared on the Earth Observatory. Click here to view the full, original record.
