Arctic Moisture on the Move
Downloads
- npmoisture_air_2014172.jpg (720x480, JPEG)
- seaiceclouds_oli_2014172_lrg.jpg (3000x2000, JPEG)
- seaiceclouds_oli_2014172_geo.tif (3000x2000, GeoTIFF)
- arcticlongswath_oli_2014172.kml (KML)
Metadata
- Sensor(s):
- Aqua - AIRS
- Landsat 8 - OLI
- Data Date: June 21, 2014
- Visualization Date: April 1, 2015
Today's story is part of our recent series Landsat Goes Over the Top: A Long View of the Arctic.
Arctic sea ice—frozen seawater floating on top of the Arctic Ocean and its neighboring seas—grows in the fall and winter and melts in the spring and summer. Since 1978, satellites monitoring this annual growth and retreat have detected an overall decline in Arctic sea ice.
Scientists such as NASA’s Linette Boisvert want to know how this decline is contributing to a warmer and wetter Arctic. One way to find out is by looking at the energy balance at the surface. Areas of ice-free ocean absorb more heat from the Sun and become warmer, increasing humidity near the surface. When the humidity at the surface is higher than that of the overlying air, the moisture is released into the atmosphere. In its vapor form, this water is a greenhouse gas that can lead to further warming and ice loss.
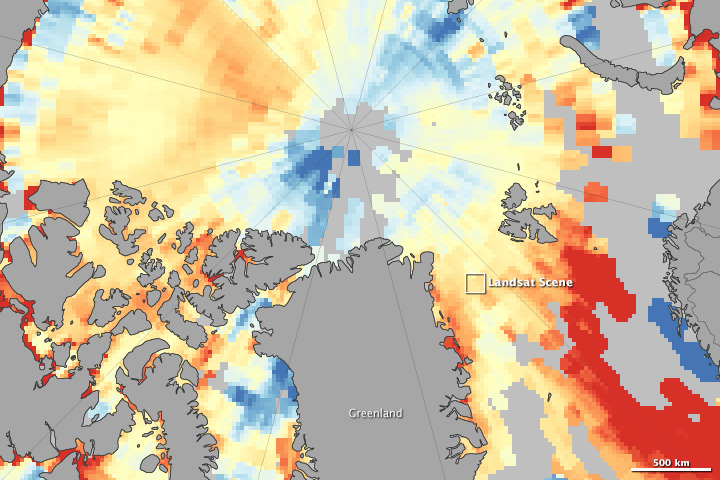
The map above, produced with data from the Atmospheric Infrared Sounder (AIRS) instrument on NASA’s Aqua satellite, represents the vertical transport of moisture over the Arctic on June 21, 2014. Orange and red areas show where moisture is leaving the surface and entering the atmosphere (evaporation); blue areas are where moisture is moving from the atmosphere to the surface. The rate at which this occurs is called the moisture flux.
Data for this map were acquired on the summer solstice, after the sea ice had started its annual retreat toward its minimum extent (usually reached in September). The transition between sea ice and ocean water is visible where the moisture flux switches from negative (blue) over the solid sea ice pack to positive (red) over ice-free waters.

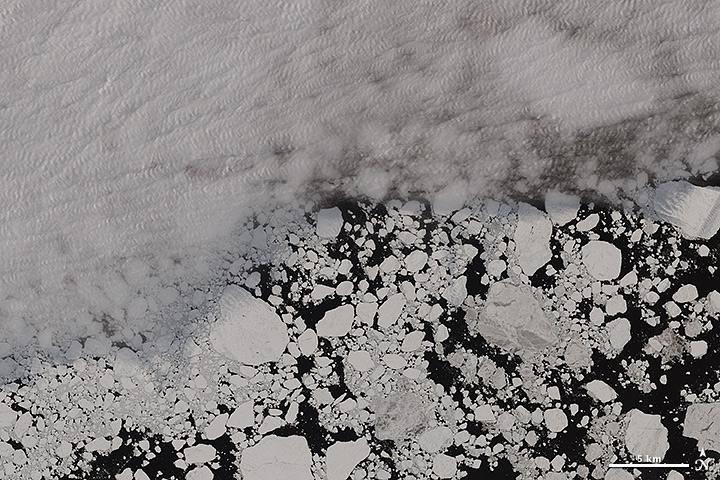
The second image shows a close up view of the Greenland Sea (within the box outlined in the top image) that was acquired on the same day by the Operational Land Imager (OLI) on Landsat 8. In this natural-color image, sea ice is less concentrated and exposes some of the dark, relatively warm ocean to the overlying air.
According to Boisvert, it’s possible that cold, dry air from the north or from Greenland moved over this area of broken ice. That, in turn, could have caused the evaporation that appears orange in the top image. The extra water vapor in the air, combined with the cold air, would condense into the low, transparent clouds that show up in the second image.
This cloud type has implications for the Arctic’s energy balance. The clouds are transparent enough to let some shortwave radiation through to the surface. But they also might prevent some longwave radiation from leaving the surface, Boisvert said. “This combination could cause more warming at the surface and increased sea ice melt.”
References
- NASA Earth Observatory (2015, February 12) Landsat Goes Over the Top: A Long View of the Arctic. Accessed April 2, 2015.
- NASA Earth Observatory, Arctic Sea Ice. Accessed April 2, 2015.
- Liu, A. Q. et al. (2006, May 10) The Effect of the Sea-ice Zone on the Development of Boundary-layer Roll Clouds During Cold Air Outbreaks. Boundary-Layer Meteorology, 118 (3), 557-581.
NASA Earth Observatory images by Jesse Allen, using AIRS data provided by Linette Boisvert (NASA/GSFC), and Landsat data from the U.S. Geological Survey and acquired by special request with the support of Theresa Arvidson (NASA/GSFC) and Eugene Fosnight (USGS/EDC). Caption by Kathryn Hansen.
This image record originally appeared on the Earth Observatory. Click here to view the full, original record.