Snowmelt Has Been Coming Earlier in Wyoming
Downloads
- wyoming_etm_2013145.jpg (720x480, JPEG)
- wyoming_oli_2013217.jpg (720x480, JPEG)
- snowmelt_percentage_1972-2013.png (720x480, PNG)
Metadata
- Sensor(s):
- Landsat 7 - ETM+
- Landsat 8 - OLI
- Data Date: May 25, 2013 - August 5, 2013
- Visualization Date: March 27, 2015

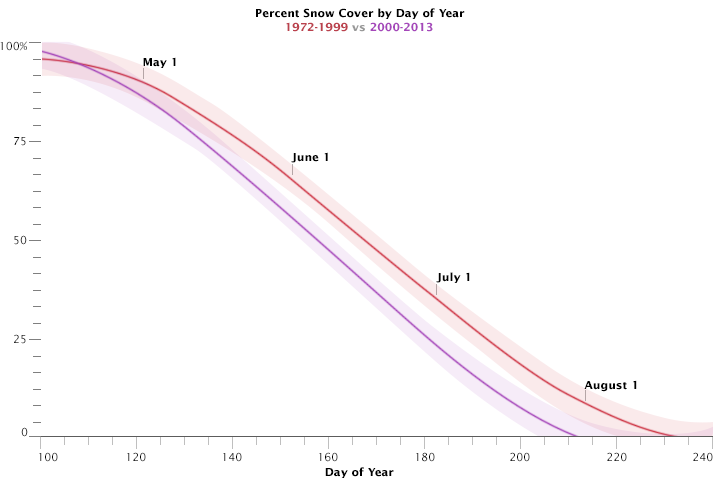
A NASA study of a basin in northwestern Wyoming revealed that the snowmelt season in that area now ends about 16 days earlier than it did from the 1970s through the 1990s. Since snowmelt is a significant water source in the state, changes in its timing affect agriculture and ecosystems and also contribute to earlier and more frequent wildfires.
“The Wind River Range is a very high mountain range with lots of snow,” said Dorothy Hall, lead author of the study and a scientist at NASA’s Goddard Space Flight Center. “Earlier snowmelt impacts the water resources of most of the state of Wyoming, which has been undergoing a drought since 1999. Monitoring and documenting changes in the timing of snowmelt helps hydrologists plan water resource management for human use and optimize reservoir management.”
In recent years, scientists using the Rutgers University snow cover climate data record (based primarily on data from National Oceanic and Atmospheric Administration satellites) found that snowmelt in the Northern Hemisphere has been starting progressively earlier since the record began in 1966. The earlier snowmelt has been especially obvious in most of the mountain ranges of the western United States.
In the new paper, Hall and her team compared snow maps derived from Landsat data and from the Moderate Resolution Imaging Spectroradiometer (MODIS) instruments on the NASA’s Terra and Aqua satellites. They also studied ground-based stream discharge measurements and daily temperature and precipitation records. The combination allowed Hall to look at a smaller scale in greater detail. The results were published online in the journal Remote Sensing of Environment.
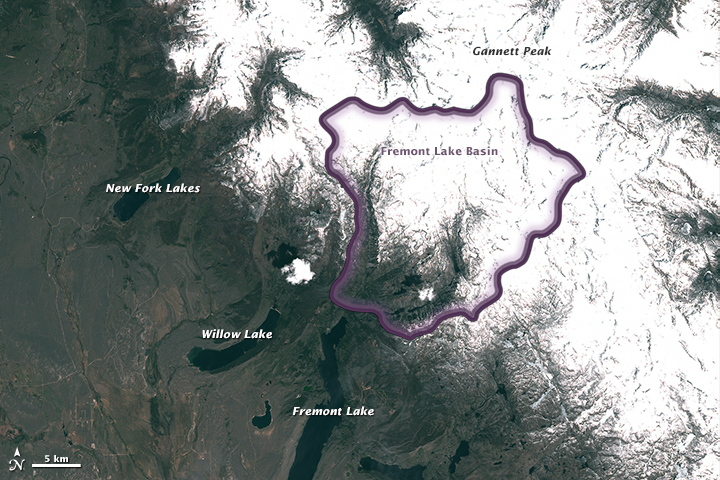
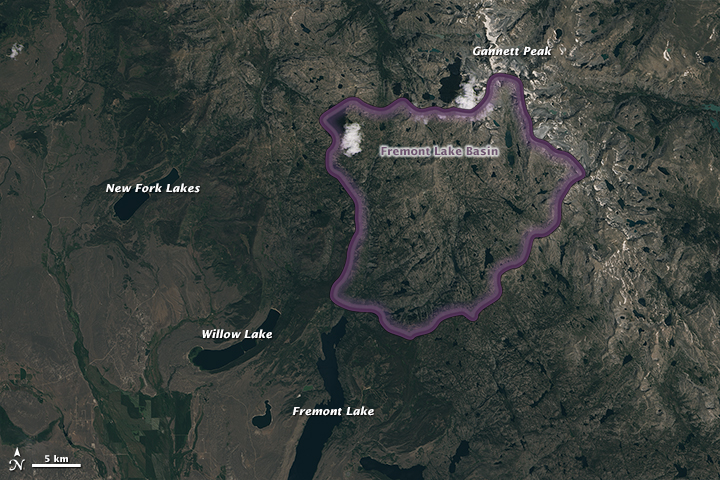
The images above, acquired by the Operational Land Imager on Landsat 8 and the Enhanced Thematic Mapper Plus on Landsat 7, show snow conditions in Wyoming’s Fremont Lake Basin on May 25 and August 5, 2013. The first image comes in the midst of the spring melt. The second image shows bare mountaintops at a time when snow cover would have remained in years past. The time-lapse animation at the bottom of this page shows most of the snowmelt season for 2013.
The graph below shows the percent of snow cover in the basin by day of year. The red line shows the average from 1972 to 1999, while the purple line shows the averages from 2000 to 2012. The shaded area around the lines shows the 95 percent confidence interval.

Hall and colleagues sorted through more than 1,000 Landsat scenes to create 227 snow maps for the period from 1972 to 2013. (The process was not automated because the team had to make sure clouds were not obscuring the snow.) MODIS images—at least 200 per year since 2000—could be analyzed automatically because the satellites make much more frequent passes over each parcel of land and standard snow map products are available from MODIS.
Hall theorized that earlier snowmelt is probably happening all along the Wind River Range, based on data from several stream gauges that she analyzed for a previous study. All gauges showed lower stream flows in springtime in the 2000s than in the 1970s, 80s, and 90s. The team saw less change after 2000, with streamflow more stable but at lower levels than in the previous decades.
References
- Hall, D.K., et al. (2015) Detection of earlier snowmelt in the Wind River Range, Wyoming, using Landsat imagery, 1972–2013. Remote Sensing of Environment, 162, 45–54. Mioduszewski, J.L., et al. (2015) Controls on Spatial and Temporal Variability in Northern Hemisphere Terrestrial Snow Melt Timing, 1979–2012. Journal of Climate, 28, 2136–2153.
- NASA (2015) MODIS Snow and Sea Ice Global Mapping Project. Accessed March 27, 2015.
NASA Earth Observatory images and video by Joshua Stevens, using Landsat data from the U.S. Geological Survey. Caption by Maria-Jose Viñas.
This image record originally appeared on the Earth Observatory. Click here to view the full, original record.