Water Levels Still Dropping Near São Paulo
Downloads
- saopaulo_oli_2015042_lrg.jpg (2000x2000, JPEG)
- saopaulo_oli_2014295_lrg.jpg (2000x2000, JPEG)
- saopaulo_oli_2014039_lrg.jpg (2000x2000, JPEG)
- brazilndvia_tmo_2015033_lrg.jpg (6909x6909, JPEG)
Metadata
- Sensor(s):
- Landsat 8 - OLI
- Terra - MODIS
- Data Date: February 8, 2014 - February 11, 2015
- Visualization Date: February 27, 2015
Southeastern and eastern Brazil is three years into one of its worst droughts in a century. The region is already 100 to 200 millimeters (4 to 8 inches) below normal rainfall for the calendar year, following 400 millimeter deficits for 2014. And the rainy season (November through March) has not brought the drought relief that citizens and civic leaders were hoping for.
The Cantareira reservoir system, which supplies water to half of the people in São Paulo, is at roughly 10 percent of capacity, according to news reports. That is up from 5 percent in October, just before the rainy season began. The depleted drinking water supply has been attributed by news and advocacy sources to a combination of unusual weather conditions and uneven resource management. Some scientists assert that deforestation has played a role in changing weather patterns and water storage.
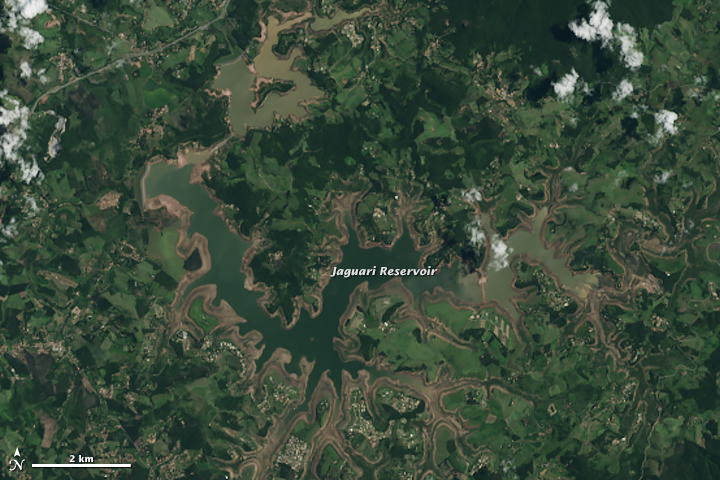
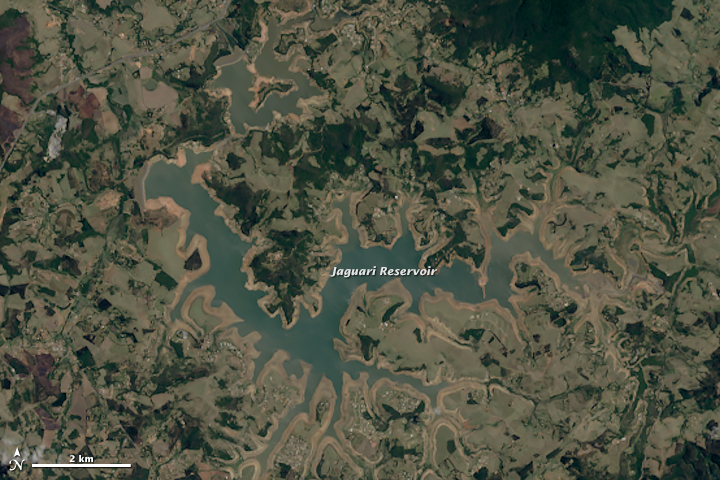
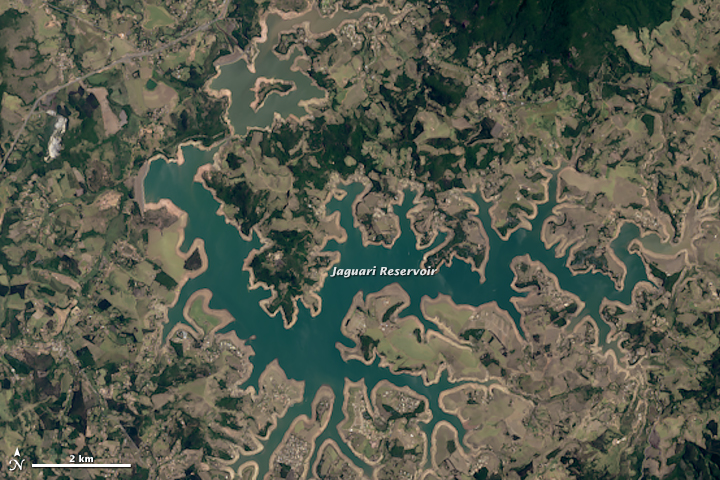
The Operational Land Imager on the Landsat 8 satellite captured these views of the Jaguari Reservoir, part of the Cantareira System. The top image was acquired on February 11, 2015; the middle image is from October 22, 2014, near the end of the dry season; and the third image shows conditions a year ago, on February 8, 2014. Note how the light-colored “bath-tub ring” of lake-bottom sediments grows around the water edges, how new islands emerge, and how some basins are devoid of water by 2015.
“The drought most definitely continues, and the images of the reservoir levels tells the story very well,” said Michael Coe, a scientist from the Woods Hole Research Center who studies land and water issues in the Amazon. “The fact that the reservoir is lower in February 2015—the height of the wet season—than in October 2014—the end of the dry season—tells us that there clearly is no recharge occurring. In other words, whatever rain has occurred during the wet season hasn’t been enough to produce significant runoff and fill the reservoirs.”
Though the water levels continue to drop, the landscape itself gives a counter-intuitive signal. February 2015 is not just greener than October (dry season), but it is also greener than February 2014, even though the decline in rainfall has persisted for several years. But timing is everything.
After rain falls, plants soak up much of the water before it trickles into waterways or percolates down into the water table, notes Marcos Heil Costa, a climate scientist at the Universidade Federal de Vicosa (Brazil). It takes just a few days for the landscape to green-up after rain, but it takes several weeks to become brown. Several rainfall events just before the 2015 Landsat image turned much of the vegetation green even as the reservoir told a different story.
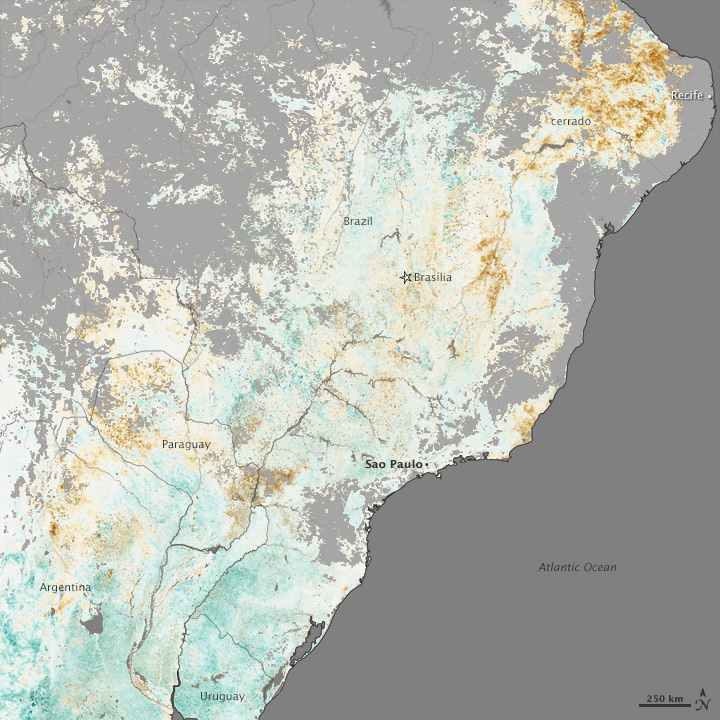
This is also clear in the map below, which shows the normalized difference vegetation index anomaly (NDVIA) for February 2–17, 2015, across much of Brazil. The map contrasts plant health in 2015 against the average conditions for 2001–2014. Brown areas show stressed vegetation, while greens indicate healthier vegetation for the time of year. Grays are areas with insufficient data, often due to persistent cloud cover. NDVI is a measure of how plant leaves absorb visible light and reflect infrared light. Stressed vegetation reflects more visible light and less infrared than healthy vegetation.
“Although the vegetation greenness in that map indicates the end of the ecological drought, it does not hide the hydrological drought,” Costa said. “Vegetation greens-up way before the aquifers and reservoirs recharge. The aquifers were severely depleted last year, and it is taking much longer to recharge them than in previous years. Dry season will start in about 30 days, and it is unlikely that the reservoirs will recharge sufficiently by then. What we are looking at is another year of severe drought in terms of water supply and hydropower generation, much likely worse than 2014.”
References and Related Reading
- CIA World Factbook (2011) Total Renewable Water Resources. Accessed March 5, 2015.
- NASA Earth Observatory (2014, October 23) Drought Shrinking São Paulo Reservoirs.
- National Geographic (2015, February 15) Quirky Winds Fuel Brazil’s Devastating Drought, Amazon’s Flooding. Accessed March 5, 2015.
- The New York Times (2015, February 17) Sao Paulo Water Crisis Linked to Growth, Pollution, and Deforestation. Accessed March 5, 2015.
- Quartz (2015, February 26) Brazil has more freshwater than any other country but its biggest city is running dry. Accessed March 5, 2015.
- Science (2015, February 20) Drought triggers alarms in Brazil’s biggest metropolis. Accessed March 5, 2015.
NASA Earth Observatory images by Joshua Stevens and Jesse Allen, using Landsat data from the U.S. Geological Survey. Caption by Mike Carlowicz, with image interpretation from Divino Figueiredo (INMET Brazil), Michael Coe (WHRC), Marcos Heil Costa (Universidade Federal de Vicosa), and Alice Grimm (Universidade Federal de Paraná).
This image record originally appeared on the Earth Observatory. Click here to view the full, original record.


