
Penetrating Tree Cover to See the Forest Floor
Downloads
- napo_sar_2013076_lrg.jpg (8000x4000, JPEG)
- napo_etm_2002008_lrg.jpg (1648x818, JPEG)
Metadata
- Sensor(s):
- Aircraft Sensors - UAVSAR
- Landsat 7 - ETM+
- Data Date: March 17, 2013
- Visualization Date: April 24, 2013
Tropical forests and wetlands are some of the most compelling and important areas of study for Earth scientists and ecologists, but they are notoriously hard to penetrate on foot or from the air. “There are vast portions of forest within the Amazon River basin that experience seasonal or semi-permanent flooding, and many of those areas are very remote, with no roads or navigable rivers,” said Bruce Chapman. “Flooding is difficult to reliably detect with optical imagery because the forest canopy obscures the view. Another problem is clouds, especially during the rainy season.”
Chapman and other remote sensing specialists at NASA’s Jet Propulsion Laboratory have been working to peek under the blanket of white (clouds) and green (leaves). Their Uninhabited Aerial Vehicle Synthetic Aperture Radar (UAVSAR) relies on microwaves instead of visible light to make images of the land surface. UAVSAR’s radar waves, which have a wavelength of over 20 centimeters (8 inches), can easily penetrate the tree canopy and the cloud cover. That means researchers can acquire data during any season, rainy or dry.
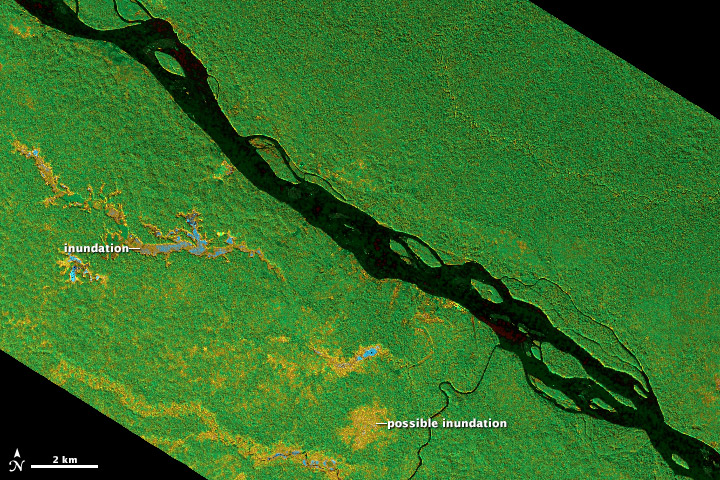
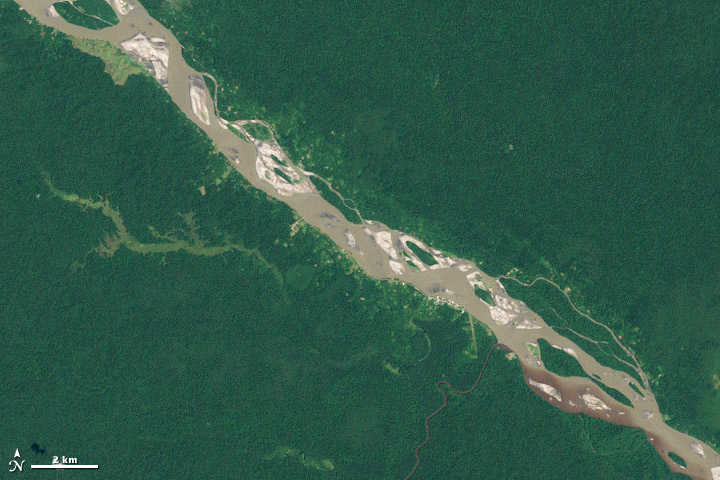
UAVSAR captured the data for the top image on March 17, 2013, as the instrument was being flown on a NASA Gulfstream C-20A aircraft. The scene shows forested wetlands around the Napo River in Ecuador and Peru at a resolution of 6 meters (20 feet) per pixel. (To see the full resolution, download the large image.) The second image, from the Enhanced Thematic Mapper Plus (ETM+) on the Landsat 7 satellite, shows roughly the same area in natural color on a rare cloud-free day in 2002. (This resolution of Landsat 7 is 30 meters per pixel.)
In the radar image, yellow, orange, and blue colors indicate areas where vegetation has probably been inundated by flood waters beneath the forest canopy. Green areas are relatively healthy forest vegetation, while the roughness of the texture gives some clues to whether it is tree cover or deforested grassland or swamp. Black indicates the open water of the Napo River and tributaries.
UAVSAR sends L-band microwave energy pulses from the sensor on the aircraft to the ground. “Open water areas are very dark because most of the radar waves bounce off the water and don't return to the radar for us to see it,” Chapman said. Forested areas are bright in radar images because the canopy reflects a lot of radar energy back to the antenna. The inundated forests stand out as very bright because the radar waves are scattering off the water and the tree trunks in a double bounce, and a lot of radar energy is therefore reflected back to the radar. Because there is a double bounce, we can detect this in the polarization of the data.”
The new data from the Napo basin will help investigators such as Kyle McDonald of JPL and the City University of New York as they map wetlands across the Amazon River basin. McDonald and Chapman are also working to calibrate radar data acquired by a synthetic aperture radar instrument on Japan’s Advanced Land Observing Satellite. The Napo data also will be compared with observations made simultaneously on the ground by Chapman’s colleagues from Michigan State University. The researchers are trying to assess the effectiveness of radar for studying wetlands, rivers, and flooding around the world.
“Often the areas that are sometimes or semi-permanently inundated have different vegetation and animal species living there, and ecologists are interested in knowing the extent of these habitats,” Chapman noted. “Changes in wetlands are also indicators of climate change, and inundated wetland areas are known to be sources of methane. NASA would like to better understand all the sources and sinks of carbon.”
References
- Alaska Satellite Facility Wetlands. Accessed April 24, 2013.
- The City University of New York (2103, April 16) NASA Radar Mapping Mission Blankets the Americas. Accessed April 24, 2013.
- Jet Propulsion Laboratory Uninhabited Aerial Vehicle Synthetic Aperture Radar. Accessed April 24, 2013.
- Jet Propulsion Laboratory Wetlands: Global Monitoring of Wetland Extent and Dynamics. Accessed April 24, 2013.
- Jet Propulsion Laboratory (2103, April 3) NASA Flies Radar South on Wide-Ranging Expedition. Accessed April 24, 2013.
- Jet Propulsion Laboratory How Imaging Radar Works. Accessed April 24, 2013.
- NASA Know Your Earth 3.0 (2013, April) UAVSAR: About Bruce Chapman. Accessed April 24, 2013.
Radar image by NASA Jet Propulsion Laboratory/California Institute of Technology. Landsat image created by Robert Simmon/NASA Earth Observatory, using Landsat data provided by the United States Geological Survey. Caption by Michael Carlowicz.
This image record originally appeared on the Earth Observatory. Click here to view the full, original record.