Tornadoes Rip Through Mississippi
Downloads
- tornadoeszm_oli_20250322_lrg.jpg (934x623, JPEG)
- tornadoes_oli_20250322_lrg.jpg (3273x2182, JPEG)
- cabins_Damage_Points_SDE_image-20250317-150308_web.jpg (720x480, JPEG)
Metadata
- Sensor(s):
- Landsat 8 - OLI
- Data Date: March 22, 2025
- Visualization Date: March 27, 2025
On March 13, an expansive upper-level trough moved into the U.S. High Plains, Upper Midwest, and Midwest and began colliding with warm, moist air over the Mississippi Valley. The interaction helped fuel a major storm system that spread severe thunderstorms across several states. Many of these were supercells, a type of long-lived storm with a powerful rotating updraft. These storms often generate destructive tornadoes, hail, and damaging winds.
Among the hardest-hit states was Mississippi, where 18 tornadoes touched down during the outbreak. These included one EF-4, one EF-3, seven EF-2, seven EF-1, and two EF-0 rated events. The onslaught damaged nearly 1,000 homes and dozens of businesses and farms, according to the Mississippi Emergency Management Agency.
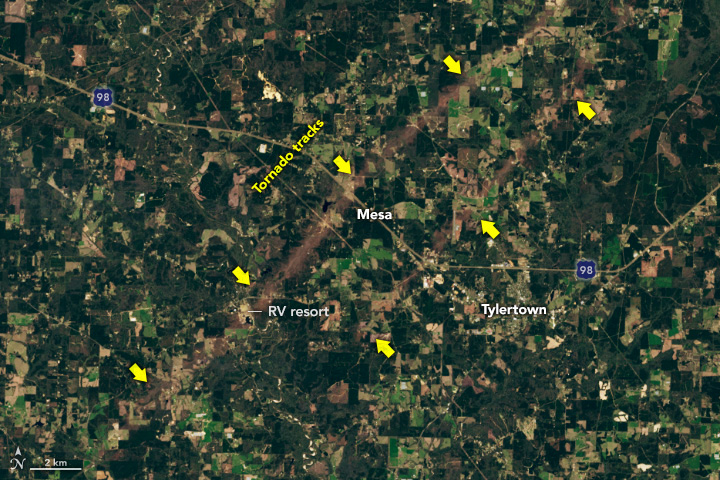
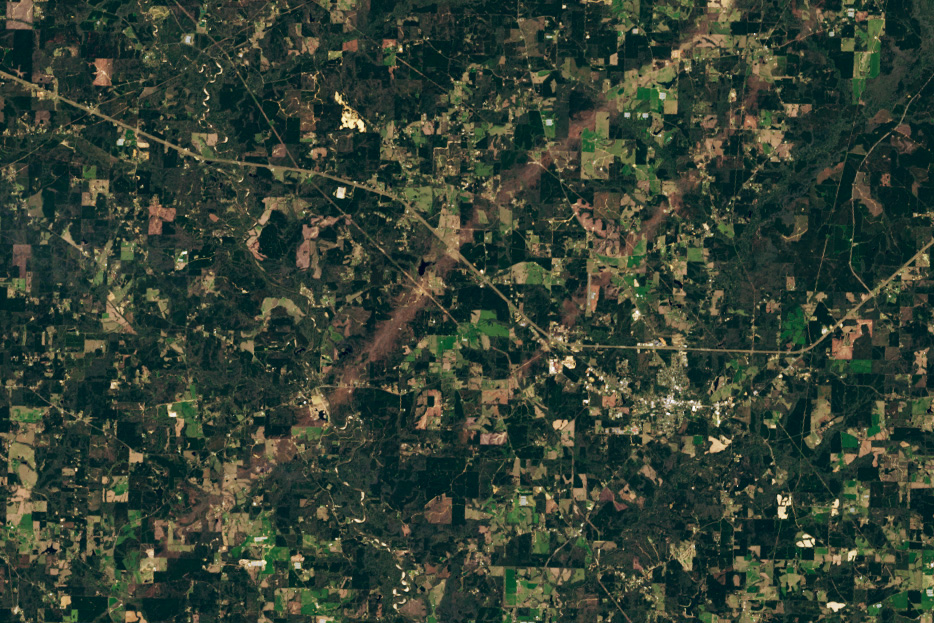
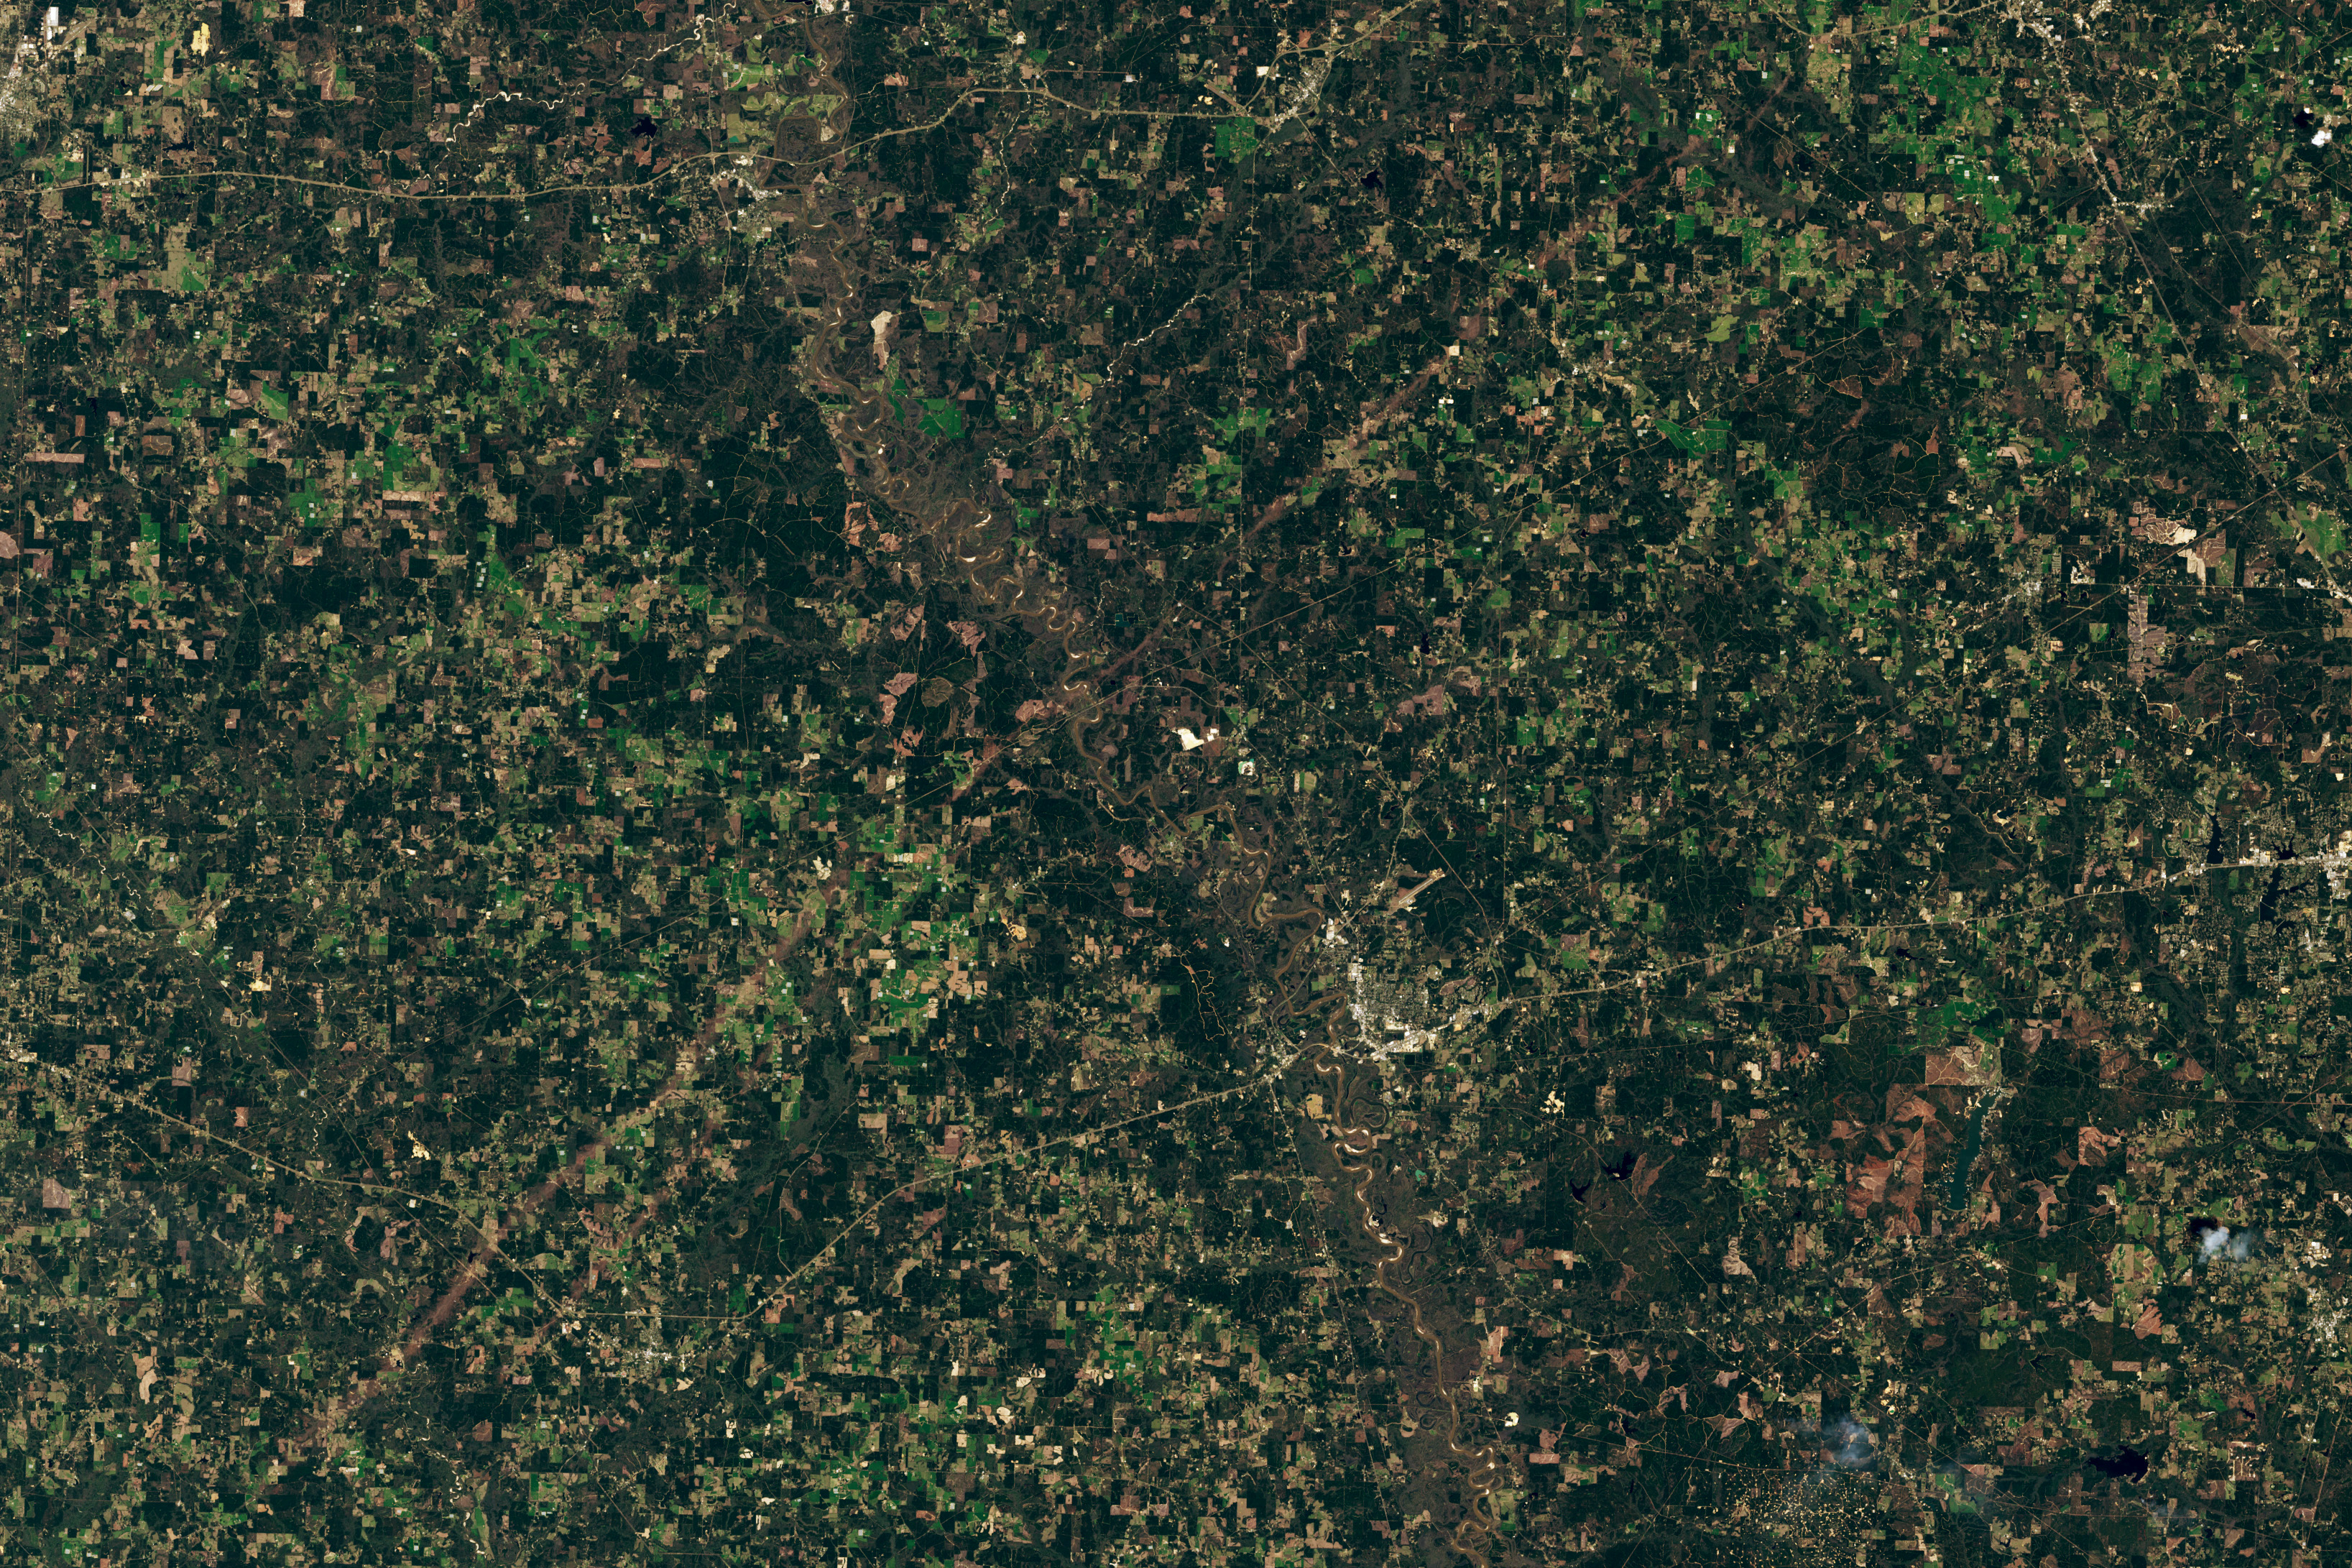
In some areas, damage was even visible to the Landsat 8 satellite. The images above, captured by the OLI (Operational Land Imager) on March 22, 2025, show a lengthy damage track extending roughly 55 miles (90 kilometers), from near Progress in the southwestern part of the state toward Williamsburg. Assessments of the damage by the National Weather Service led them to assign the event an EF-4 rating, making this one of the strongest tornadoes of the outbreak. They estimated peak winds of 170 miles (274 kilometers) per hour in some areas.

Photographs taken from the ground show how fierce winds lopped off trees, flipped cars and trucks, and tore homes from their foundations. The photograph above, from NOAA’s Damage Assessment Toolkit, shows a grove of trees with their tops sheared off and damaged cabins near Paradise Ranch RV Resort, in one of several areas in Mississippi that experienced widespread destruction.
Three other smaller tornado tracks are also visible in the Landsat images: an EF-3 track from Tylertown to Goss, an EF-2 track from Melba to Moscos, and an EF-2 track from Bassfield to Williamsburg. In a rare occurrence, the Bassfield tornado even crossed paths with the EF-4 track, about 41 minutes after the first tornado passed, leaving an X-shaped pattern of damage in a forested area in Covington County (see below).
One location in western Covington County just north of Spring Hill School Road was struck twice by tornadoes just 41 minutes apart this past Saturday afternoon.
— NWS Jackson MS (@NWSJacksonMS) March 21, 2025
The first tornado was more narrow as it approached the end of its path. The next storm that followed was wider. pic.twitter.com/mzzaJZAzRw
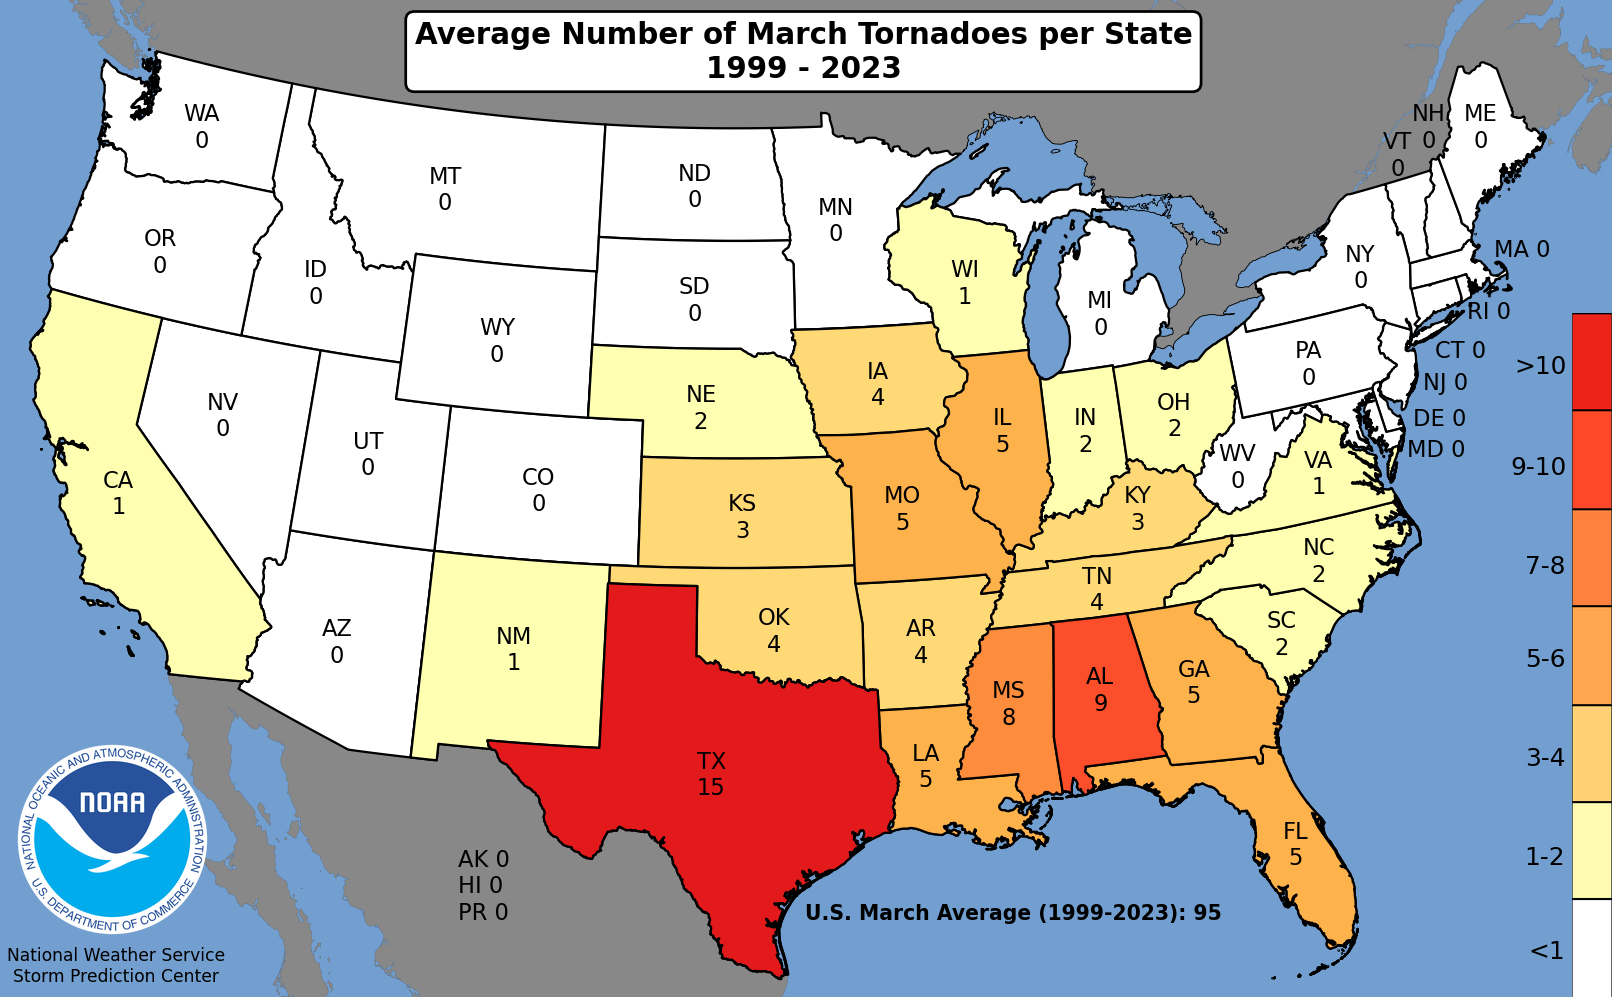
The severe weather brought destruction to other states as well. According to news reports, the weather system produced at least 112 tornadoes that touched down in 14 states between March 14 and 16, taking dozens of lives, flattening scores of homes, and disrupting power supplies. Of those, at least 44 were classified as "strong" tornadoes, meaning they produced at least EF-2 damage on the Enhanced Fujita scale. For comparison, the United States typically sees 95 tornadoes in all of March.
In the wake of these storms, the NASA Disasters Program provided multiple types of satellite imagery to the Southern Region of the National Weather Service to support their damage assessment process. National Weather Service damage assessments serve as the official record of the path and strength of each tornado and are used to inform state and federal disaster declarations, help emergency responders prioritize aid, and validate and improve early warning systems. Identifying damaged areas and tornado tracks can be challenging in rural areas with limited road access, but satellite data helps provide a more complete picture.
At NASA’s Langley Research Center (LaRC), researchers are also harnessing satellite data to identify atmospheric patterns that can indicate severe weather on the ground. The NASA team is developing an open-source machine learning model that uses geostationary satellite data to identify potential overshooting cloud tops and above-anvil cirrus plumes, features that often appear at the tops of storms roughly 10 minutes before the most severe weather hits. According to Kristopher Bedka, an atmospheric scientist at LaRC, tracking the features can provide valuable lead time that saves lives and property.
References
- Bedka, K. M., et al. (2018) The Above-Anvil Cirrus Plume: An Important Severe Weather Indicator in Visible and Infrared Satellite Imagery. Weather and Forecasting, 33(3), 729-765.
- CNN (2025, March 17) Storm system sweeping across US kills at least 39 people. Accessed March 27, 2025.
- Fox Weather (2025, March 15) Mississippi tornadoes turn deadly as violent storms unleash catastrophic damage across South. Accessed March 27, 2025.
- Mississippi Emergency Management Agency (2025, March 20) March 14-15, 2025, Severe Weather Update #4. Accessed March 27, 2025.
- NASA Applied Sciences (2025, March 24) Tracking Tornadoes from Space. Accessed March 27, 2025.
- NASA Applied Sciences (2025, March 24) Disasters mapping portal. Accessed March 27, 2025.
- NASA Earth Observatory (2021, June 16) A Cirrus Sign of Tornadoes. Accessed March 27, 2025.
- NASA Earth Observatory (2022, May 15) Spotting Severe Storms with Satellites. Accessed March 27, 2025.
- National Weather Service New Orleans, via Facebook (2025, March 17) Here’s the preliminary storm survey results for the tornadoes on Saturday. Accessed March 27, 2025.
- NOAA (2025) Damage Assessment Toolkit. Accessed March 27, 2025.
- NOAA Storm Prediction Center (2025, March 15) 20250315’s Storm Reports. Accessed March 27, 2025.
- NOAA Storm Prediction Center (2025, January 7) Severe Weather Maps, Graphics, and Data Page. Accessed March 27, 2025.
- Storm Prediction Center (2023) 25-Year Average Number of Tornadoes per State by Month (All tornadoes, 1999-2023). Accessed March 27, 2025.
- The Weather Channel (2025, March 18) Tornado Outbreak Spawned EF4s In Arkansas, Mississippi; Over 110 Twisters Confirmed In South, Midwest, East. Accessed March 27, 2025.
NASA Earth Observatory images by Wanmei Liang, using Landsat data from the U.S. Geological Survey. Photograph from NOAA’s Damage Assessment Toolkit, taken by a member of a National Weather Service storm survey team. Story by Adam Voiland.
This image record originally appeared on the Earth Observatory. Click here to view the full, original record.