The Fast Fire Threat
Downloads
- nwokfire_amo_20170306_lrg.jpg (4133x3307, JPEG)
- nwokfire_tmo_20170307_lrg.jpg (4133x3307, JPEG)
- NorthwestOk_2017_HooverFireDept_PG.jpg (720x480, JPEG)
- westernfires_tmo_2020253_lrg.jpg (5583x4187, JPEG)
- campfire_oli_2018312_crop_lrg.jpg (3017x2011, JPEG)
- labordayfires_anim_20200911.mp4 (MPEG)
- coldsprings_amo_20200907_lrg.jpg (3507x2480, JPEG)
Metadata
- Sensor(s):
- Aqua - MODIS
- Terra - MODIS
- Landsat 8 - OLI
- Data Date: March 6, 2017 - March 7, 2017
- Visualization Date: December 9, 2024
Large “megafires” are often the most noticeable fires in satellite imagery. Yet another type—fast fires—are more dangerous and destructive.
This was the finding of a recent University of Colorado Boulder analysis of two decades of NASA satellite data. “We’ve been focused on the wrong metric,” said Jennifer Balch, director of the Environmental Data Science Innovation & Inclusion Lab and lead author of the study. “It’s fire speed that really matters.”
To be considered a fast fire, blazes must achieve a growth rate of at least 16 square kilometers (6 square miles) in a day. Fast fires also share other key features: they’re propelled by strong winds, usually rage in grasslands and shrublands rather than forests, and often burn in the autumn or winter when fuels are exceptionally dry.
The researchers analyzed more than 60,000 fires detected by the Aqua and Terra satellites between 2001 and 2020. Only 3 percent met the fast-fire threshold, but these fires caused 89 percent of damage, 66 percent of deaths, and $18.9 billion in suppression costs.
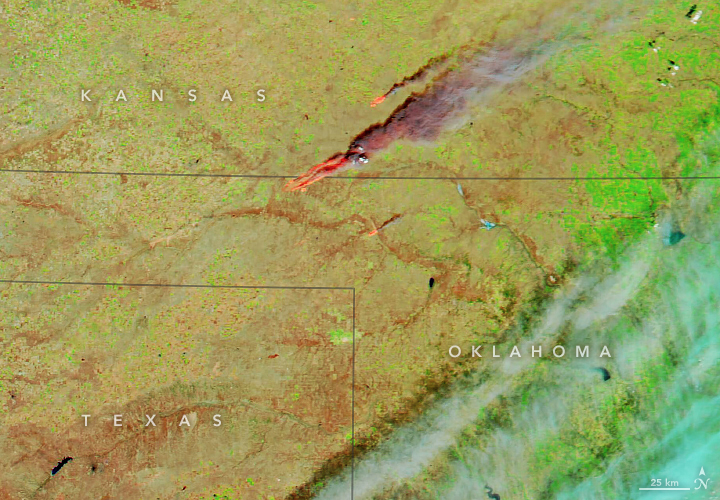
The fastest of the fires tracked, the Northwest Oklahoma Complex (above), hit cattle and ranchers the hardest. Roughly 4,000 animals died after lightning ignited fires in prairie land near the Oklahoma-Kansas border on March 6, 2017. When the fire cluster—including the Starbuck, Selman, Beaver, and 283 fires—was fully extinguished 16 days later, flames had consumed 151 structures and killed eight people.
The prairie was already primed to burn. Several months earlier, abundant rain had fueled unusually lush growth. By March, near-record heat and several months of drought had turned that growth into flammable, dead grass. On March 6, a cold front brought 50-mile (80-kilometer) per hour winds roaring across the landscape. As these winds fanned the lightning-induced flames, the Northwest Oklahoma Complex charred nearly 3,000 square kilometers, an area nearly the size of Rhode Island.
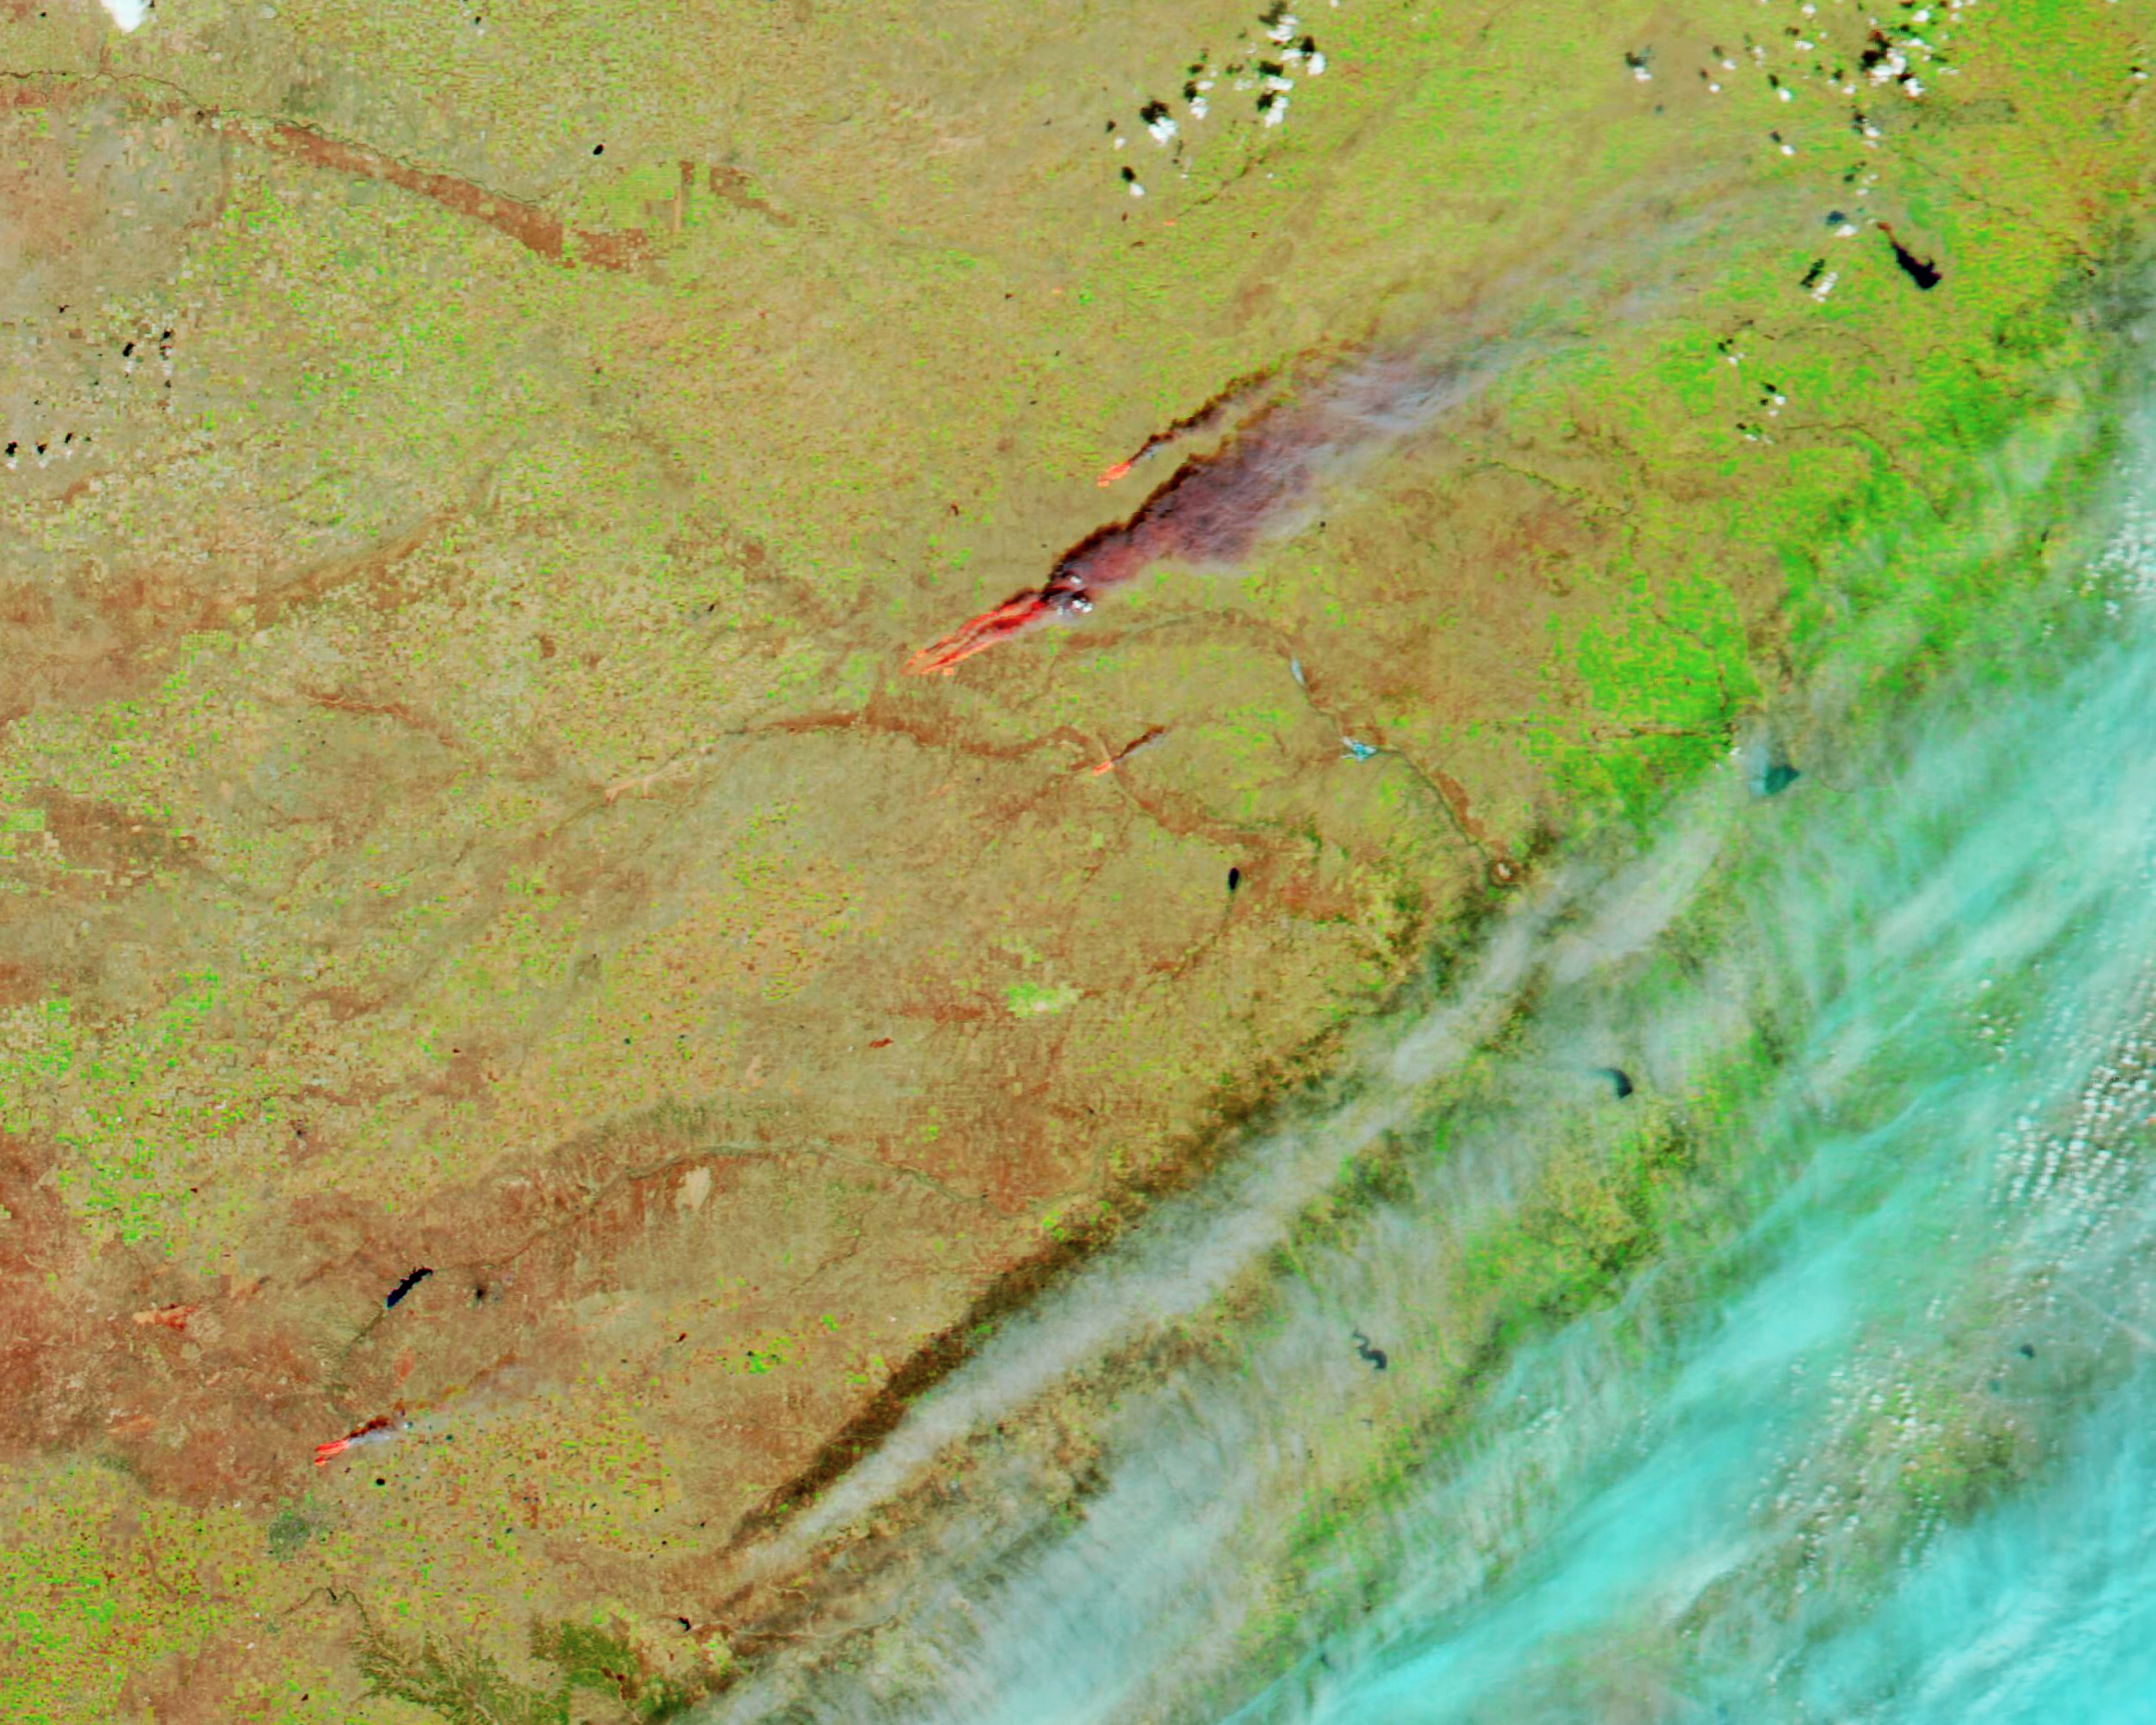
Much of the growth happened on the fire’s first day, a common feature of fast fires. The MODIS (Moderate Resolution Imaging Spectroradiometer) sensors on Aqua and Terra acquired the images at the top of the page on March 6 (left) and March 7 (right), highlighting the fires’ stunning growth rate—a maximum of 2,142 square kilometers in a day. By comparison, the top 20 fastest fires in the database achieved maximum growth rates of 380 square kilometers in a day; the average maximum growth rate for all fires was just 2.5 square kilometers. The nearby Perryton fire, the fourth fastest, grew at a maximum rate of 1,009 square kilometers in a day.
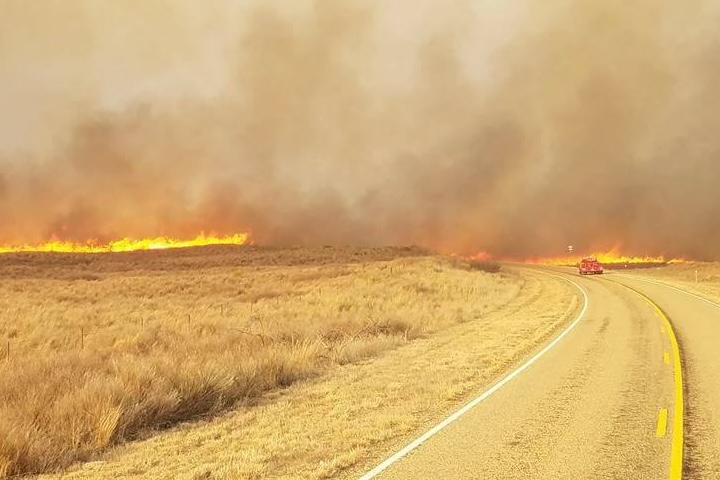
“When you have extreme wind events, fires can become uncontrollable,” said Michael Falkowski, manager of NASA’s wildland fire program. “For safety reasons, firefighters have to get out of the way.”
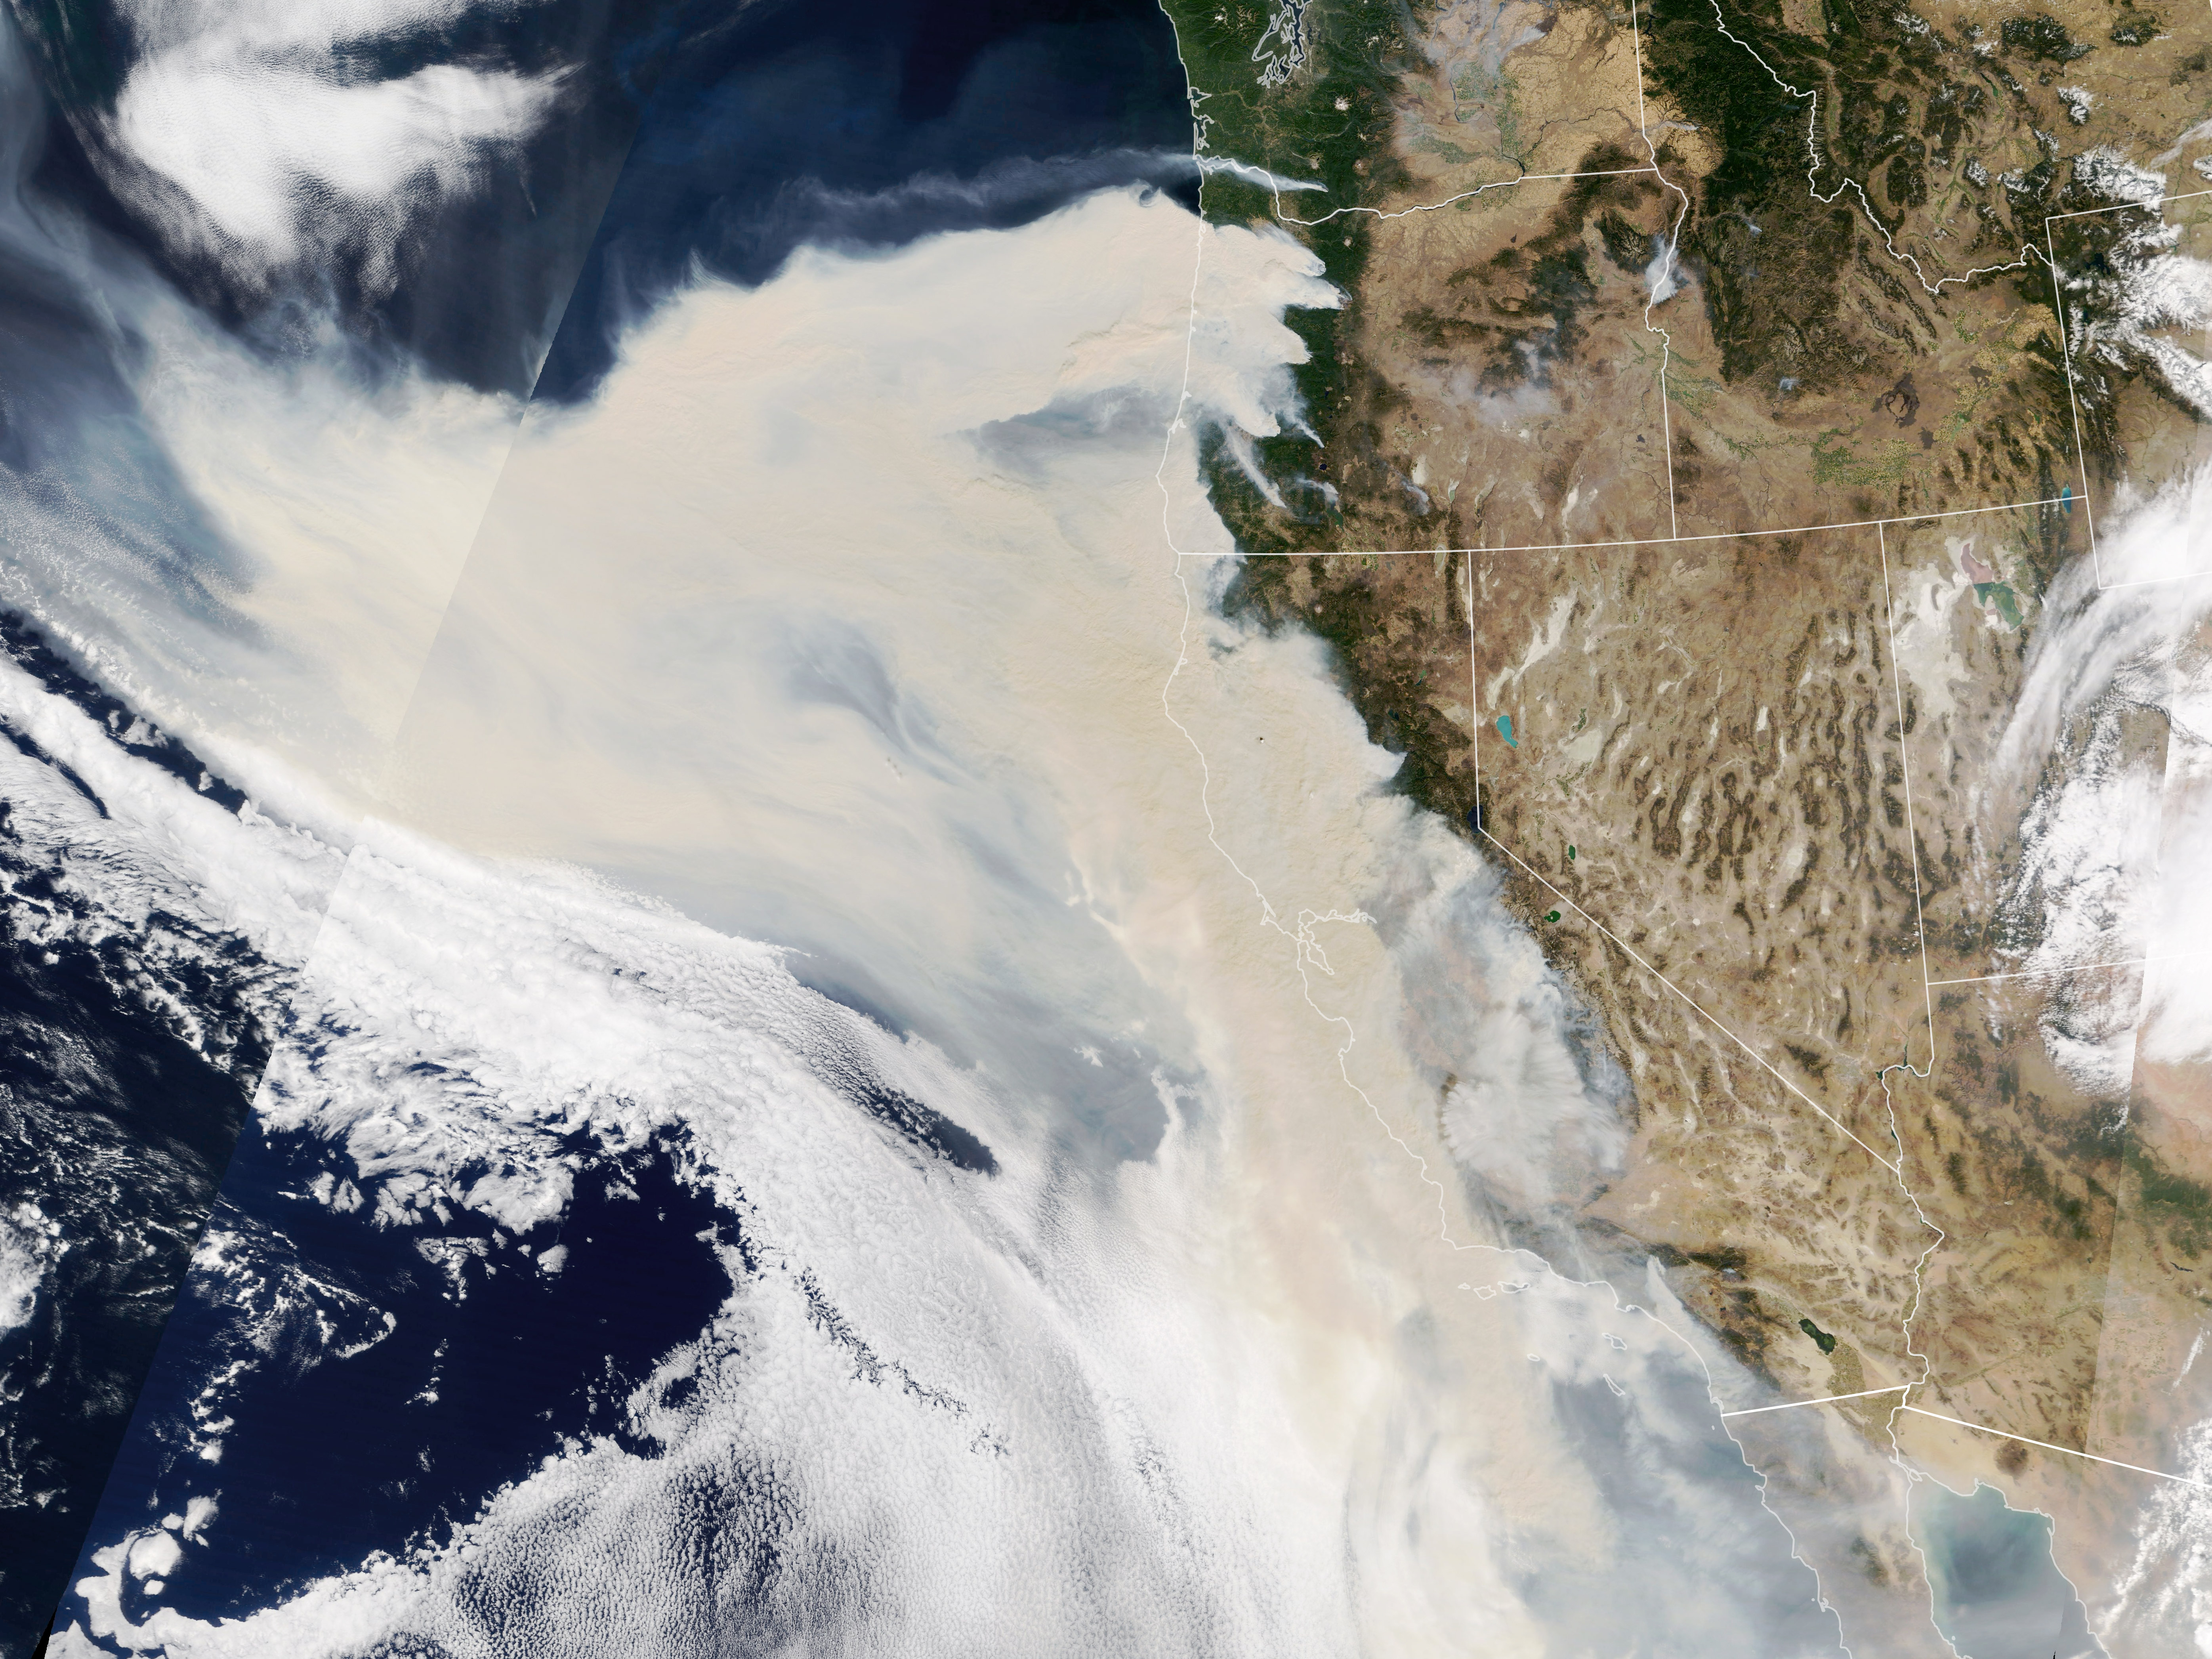
The visualization above highlights the leading role of wind in the 2020 Labor Day fires in Washington and Oregon, another notable group of fast fires identified by the researchers. In two weeks, as much land burned west of the Cascades as during the past 50 years, according to a U.S. Forest Service analysis.
One of the Labor Day fires, the Cold Springs fire (second 27 of animation) in northern Washington, was the third-fastest fire in the database and the product of an unusual set of meteorological circumstances. The setup began thousands of miles away with three powerful typhoons that struck the Korean peninsula in quick succession.
The typhoons disrupted the normal flow of the jet stream by amplifying huge undulating meanders in the atmosphere known as Rossby waves. This caused a train of these waves to buckle and break over the Pacific Northwest, creating an intense ridge of high pressure that pulled hot, dry air to the surface and generated record-breaking heat.

This, along with a low-pressure system over the Four Corners area, fueled powerful easterly winds over the Pacific Northwest. As seen in the visualization, these winds accelerated as they streamed over the Columbia Plateau and into the Okanogan Valley in northern Washington on September 7, fanning fires ignited by damaged power lines and destroying dozens of homes on the Colville Indian Reservation. The visualization is based on data from the HRRR (High-Resolution Rapid Refresh) model and VIIRS (Visible Infrared Imaging Radiometer Suite); the fastest winds are depicted in purple.
On September 8, winds strengthened as they spread across the plateau, streamed past the Cascades, and fanned several megafires at lower elevations in Oregon, including the Riverside, Beachie Creek, Lionshead, and Holiday Farm fires. The visualization ends focused on the Holiday Farm fire (second 50), a blaze that devastated the town of Blue River and destroyed more than 500 homes and offices. Together the Labor Day fires produced stunning amounts of smoke (below) that engulfed much of Washington, Oregon, and California for more than a week.
The researchers also found that fast fires grew faster over the study period, especially in the Western U.S. The trend was strongest in California’s chaparral, Idaho’s Snake River Plain, and the Columbia Plateau. In California, for instance, fires grew 398 percent faster by the study’s end.
More research is needed to determine why fast fires are speeding up. One factor could be that as climate change has made ecosystems drier, more forests have transitioned to grasslands, making it easier for fast fires to spread, Balch said. Or fires might be igniting more easily in areas prone to fast fires because more people are living and building in them. Wherever people go, fire follows. As much 97 percent of fires are lit by humans and the proportion of fires started by people is rising, earlier research from Balch’s lab shows.
Still, only a small number of fast fires cause most of the destruction and loss, Falkowski noted. “This problem is solvable if communities and individuals take steps to mitigate risks.”
Experts suggest proven ways to reduce risks. For instance, communities can implement building codes that incentivize fire-resistant materials and plan for evacuations, the researchers said. Homeowners can ensure roofs and other building materials are fire resistant, remove flammable material from yards, and take steps to protect structures within their home ignition zone, the National Interagency Fire Center recommends.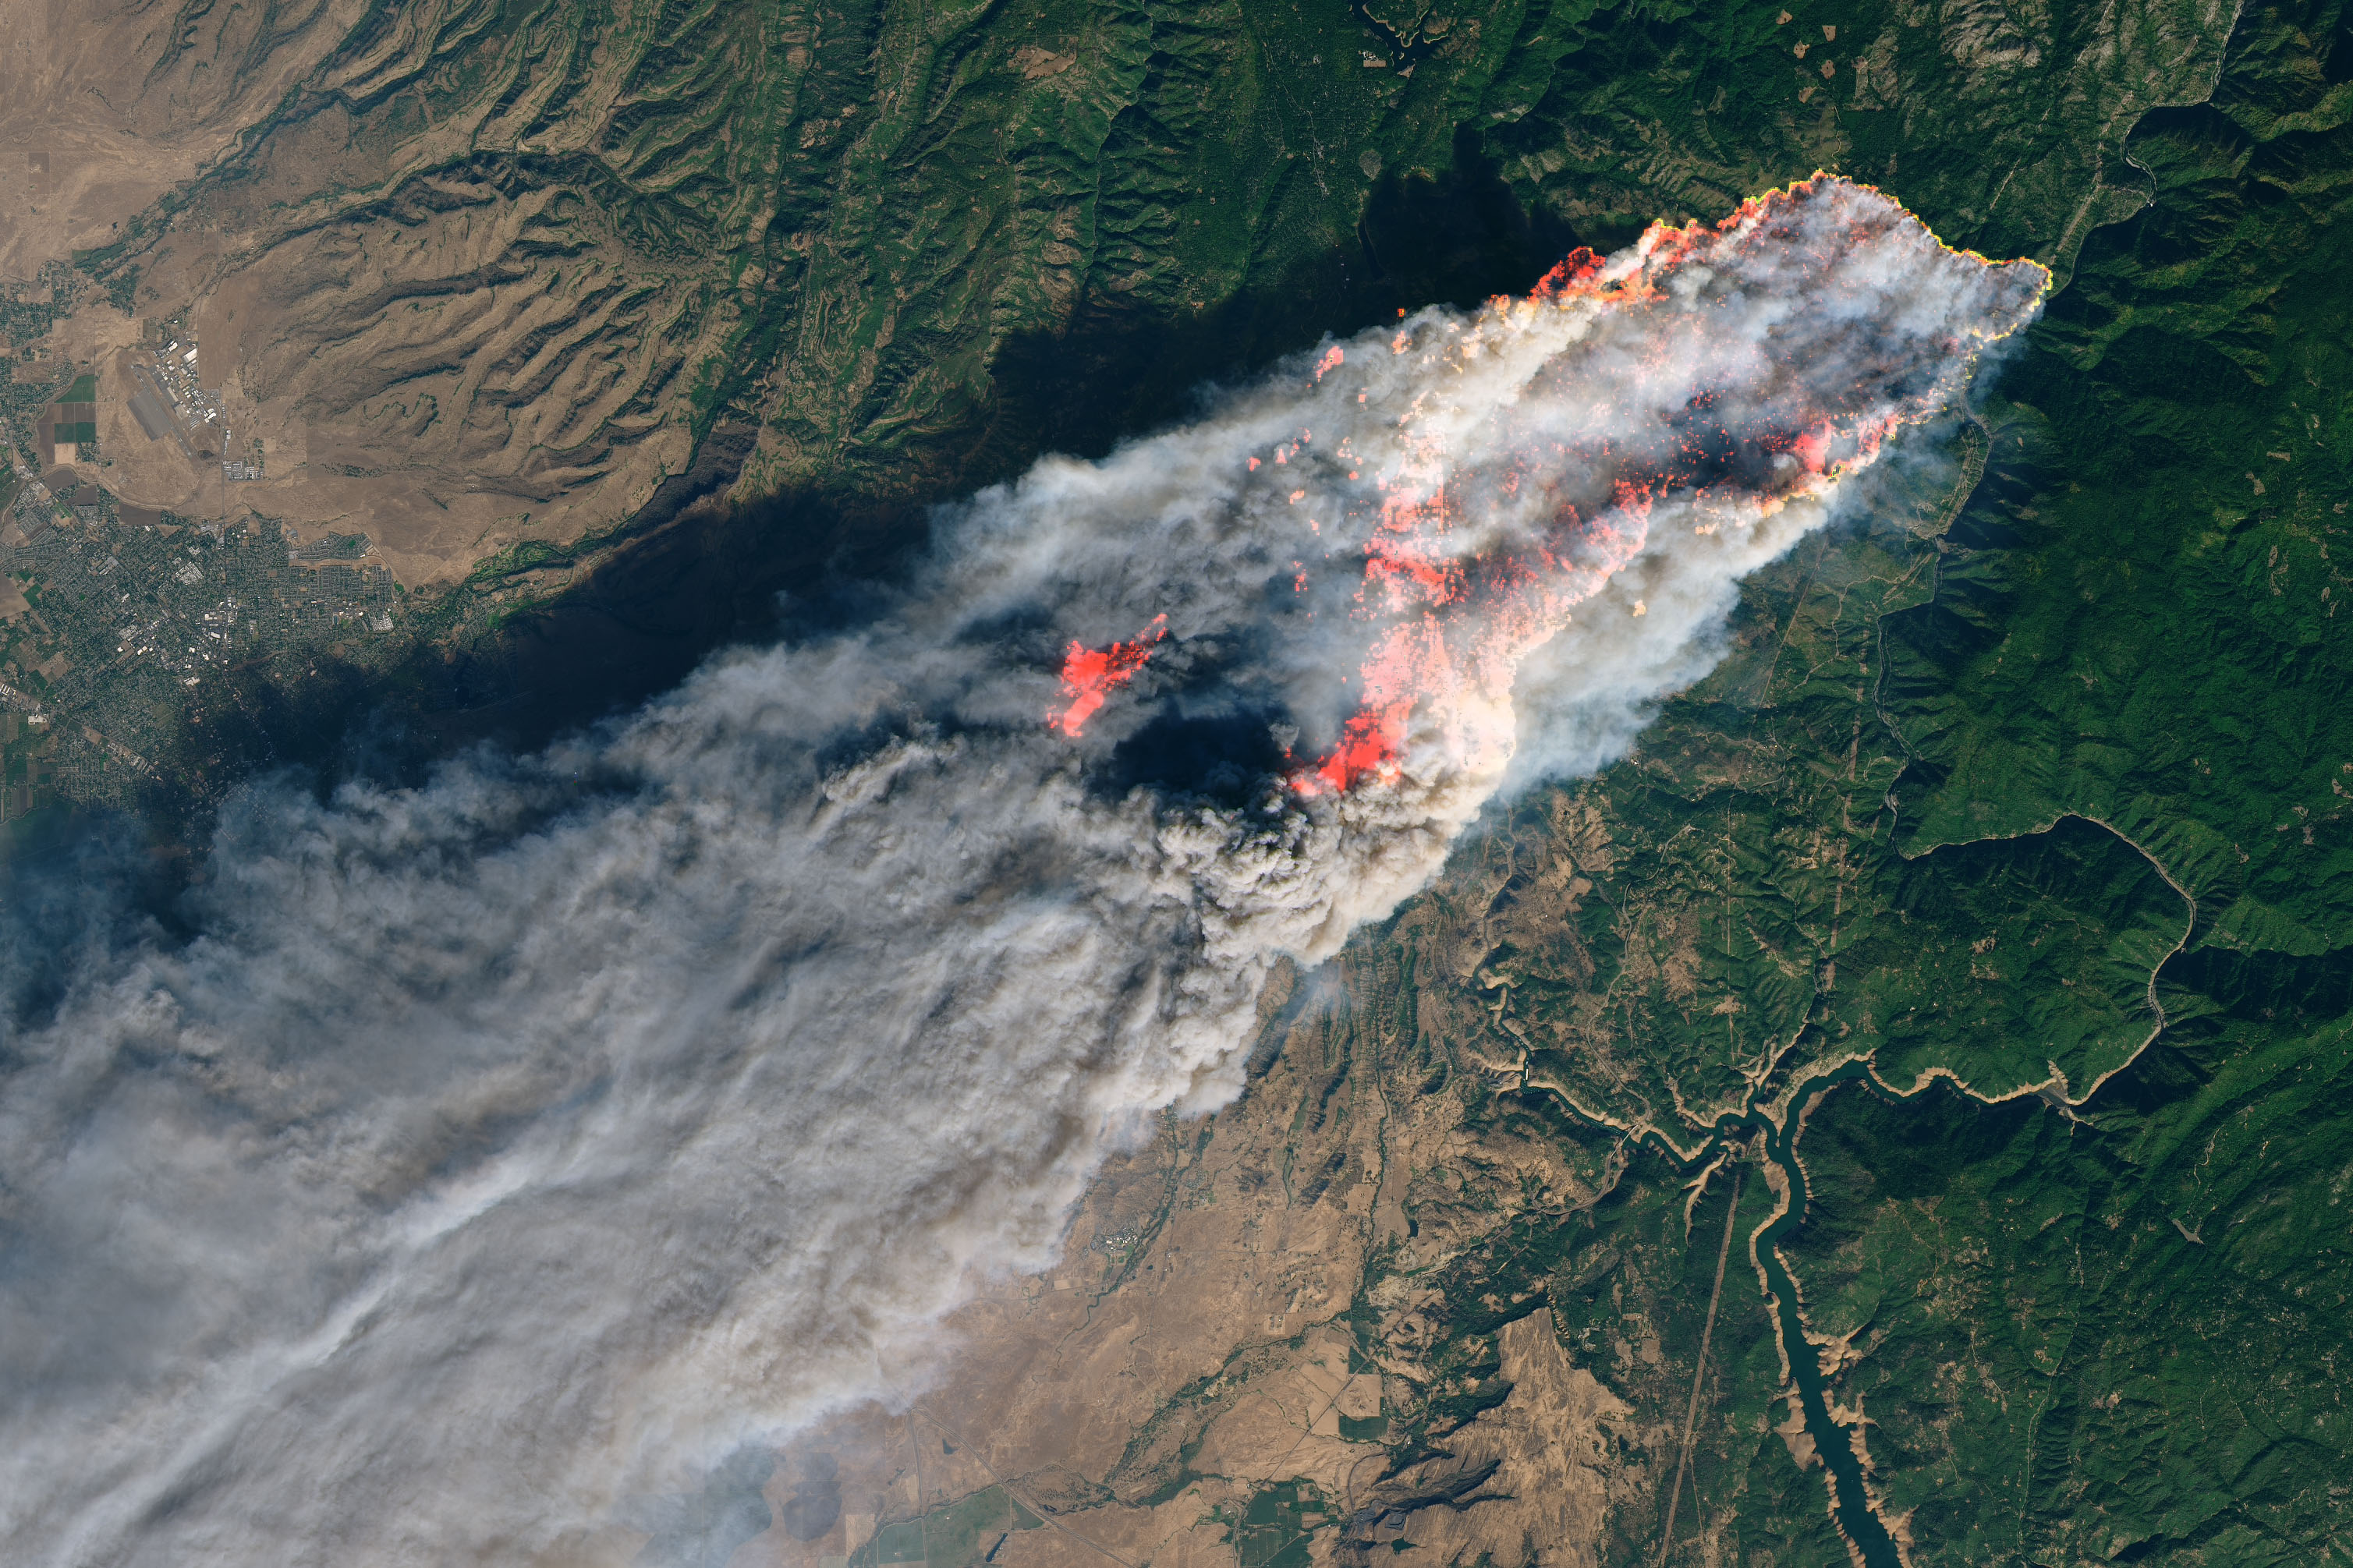
“We expect to see more fast fires in the future,” said Balch. “Devastating and fast-moving fires, such as the Camp fire in California and Lahaina fire in Hawaii, show how critical it is to plan for them.”
Editor’s Note: You can hear Balch and Falkowski discuss fast fire in an online webinar hosted by FEMA on December 12th, 2024, at 4 PM ET.
References
- Balch, J., et al. (2024) The fastest-growing and most destructive fires in the US (2001 to 2020). Science, 386, 425-431.
- CIRES (2024, October 24) Fire speed, not size, drives threat to people, infrastructure. Accessed December 11, 2024.
- The Conversation (2024, July 16) How to protect your home from wildfires—advice from fire prevention experts on creating defensible space. Accessed December 11, 2024.
- Green Oregon (2025, January 10) Understanding Fast Fires Through Earth Science Data - U.S. Fire Administration. Accessed December 11, 2024.
- Higuera, P., et al. (2023) Shifting social-ecological fire regimes explain increasing structure loss from Western wildfires. PNAS Nexus. (2)3, 5.
- Lindley T., et al. (2019) Megafires on the Southern Great Plains. Journal of Operational Meteorology, (7), 164-79.
- Mesonet (2017, March 14) February’s Weather Role in NW Oklahoma Complex Fires. Accessed December 11, 2024.
- NASA Earth Observatory (2020, September 9) Historic Fires Devastate the U.S. Pacific Coast. Accessed December 11, 2024.
- NASA Earth Observatory (2017, March 7) People Cause Most U.S. Wildfires. Accessed December 11, 2024.
- National Weather Service (2021, January 31) Cold Springs Fire, Northern Washington. Accessed December 11, 2024.
- NCASI (2021) The Labor Day Fires of 2020. Accessed December 11, 2024.
- NOAA (2017, March 22) Late winter wildfires burn through Texas, Oklahoma, and Kansas in March 2017. Accessed December 11, 2024.
- PBS Weathered (2024, October 10) Is this type of fire Impossible to stop? Accessed December 11, 2024.
- Puxley, B., et al. (2024) The wildfire impacts of the 2017-2018 precipitation whiplash event across the Southern Great Plains. Environmental Research Letters, 19, 074029.
- Radeloff, V., et al. (2023) Rising wildfire risk to houses in the United States, especially in grasslands and shrublands. Science, 382,702-707.
- Russell, E., et al. (2024) The meteorology and impacts of the September 2020 Western United States extreme weather event. Weather and Climate Extremes, 43, 100647.
- Scientific American (2024, October 28) Wildfires Are Moving Faster and Causing More Damage. Accessed December 11, 2024.
- U.S. Fire Administration (2024) Fire Adapted Communities. Accessed December 11, 2024.
- U.S. Forest Service (2022) Cascadia Burning: The historic, but not historically unprecedented, 2020 wildfires in the Pacific Northwest, USA. Accessed December 11, 2024.
NASA Earth Observatory images by Michala Garrison and Lauren Dauphin, using MODIS data from NASA EOSDIS LANCE and GIBS/Worldview and Landsat data from the U.S. Geological Survey. Animation by Adam Silcott (Navteca) and adapted by Michala Garrison (NASA Earth Observatory), based on wind data from HRRR, fire data from VIIRS, and burn severity data from USGS. The Camp Fire and Pacific Coast smoke images were first published in 2018 and 2020. Photograph courtesy of the National Weather Service. Story by Adam Voiland.
This image record originally appeared on the Earth Observatory. Click here to view the full, original record.