
Strait of Tartary in Autumn
Downloads
- tartary_oli2_2022298_lrg.jpg (6178x6864, JPEG)
Metadata
- Sensor(s):
- Landsat 9 - OLI-2
- Data Date: October 25, 2022
- Visualization Date: November 17, 2022
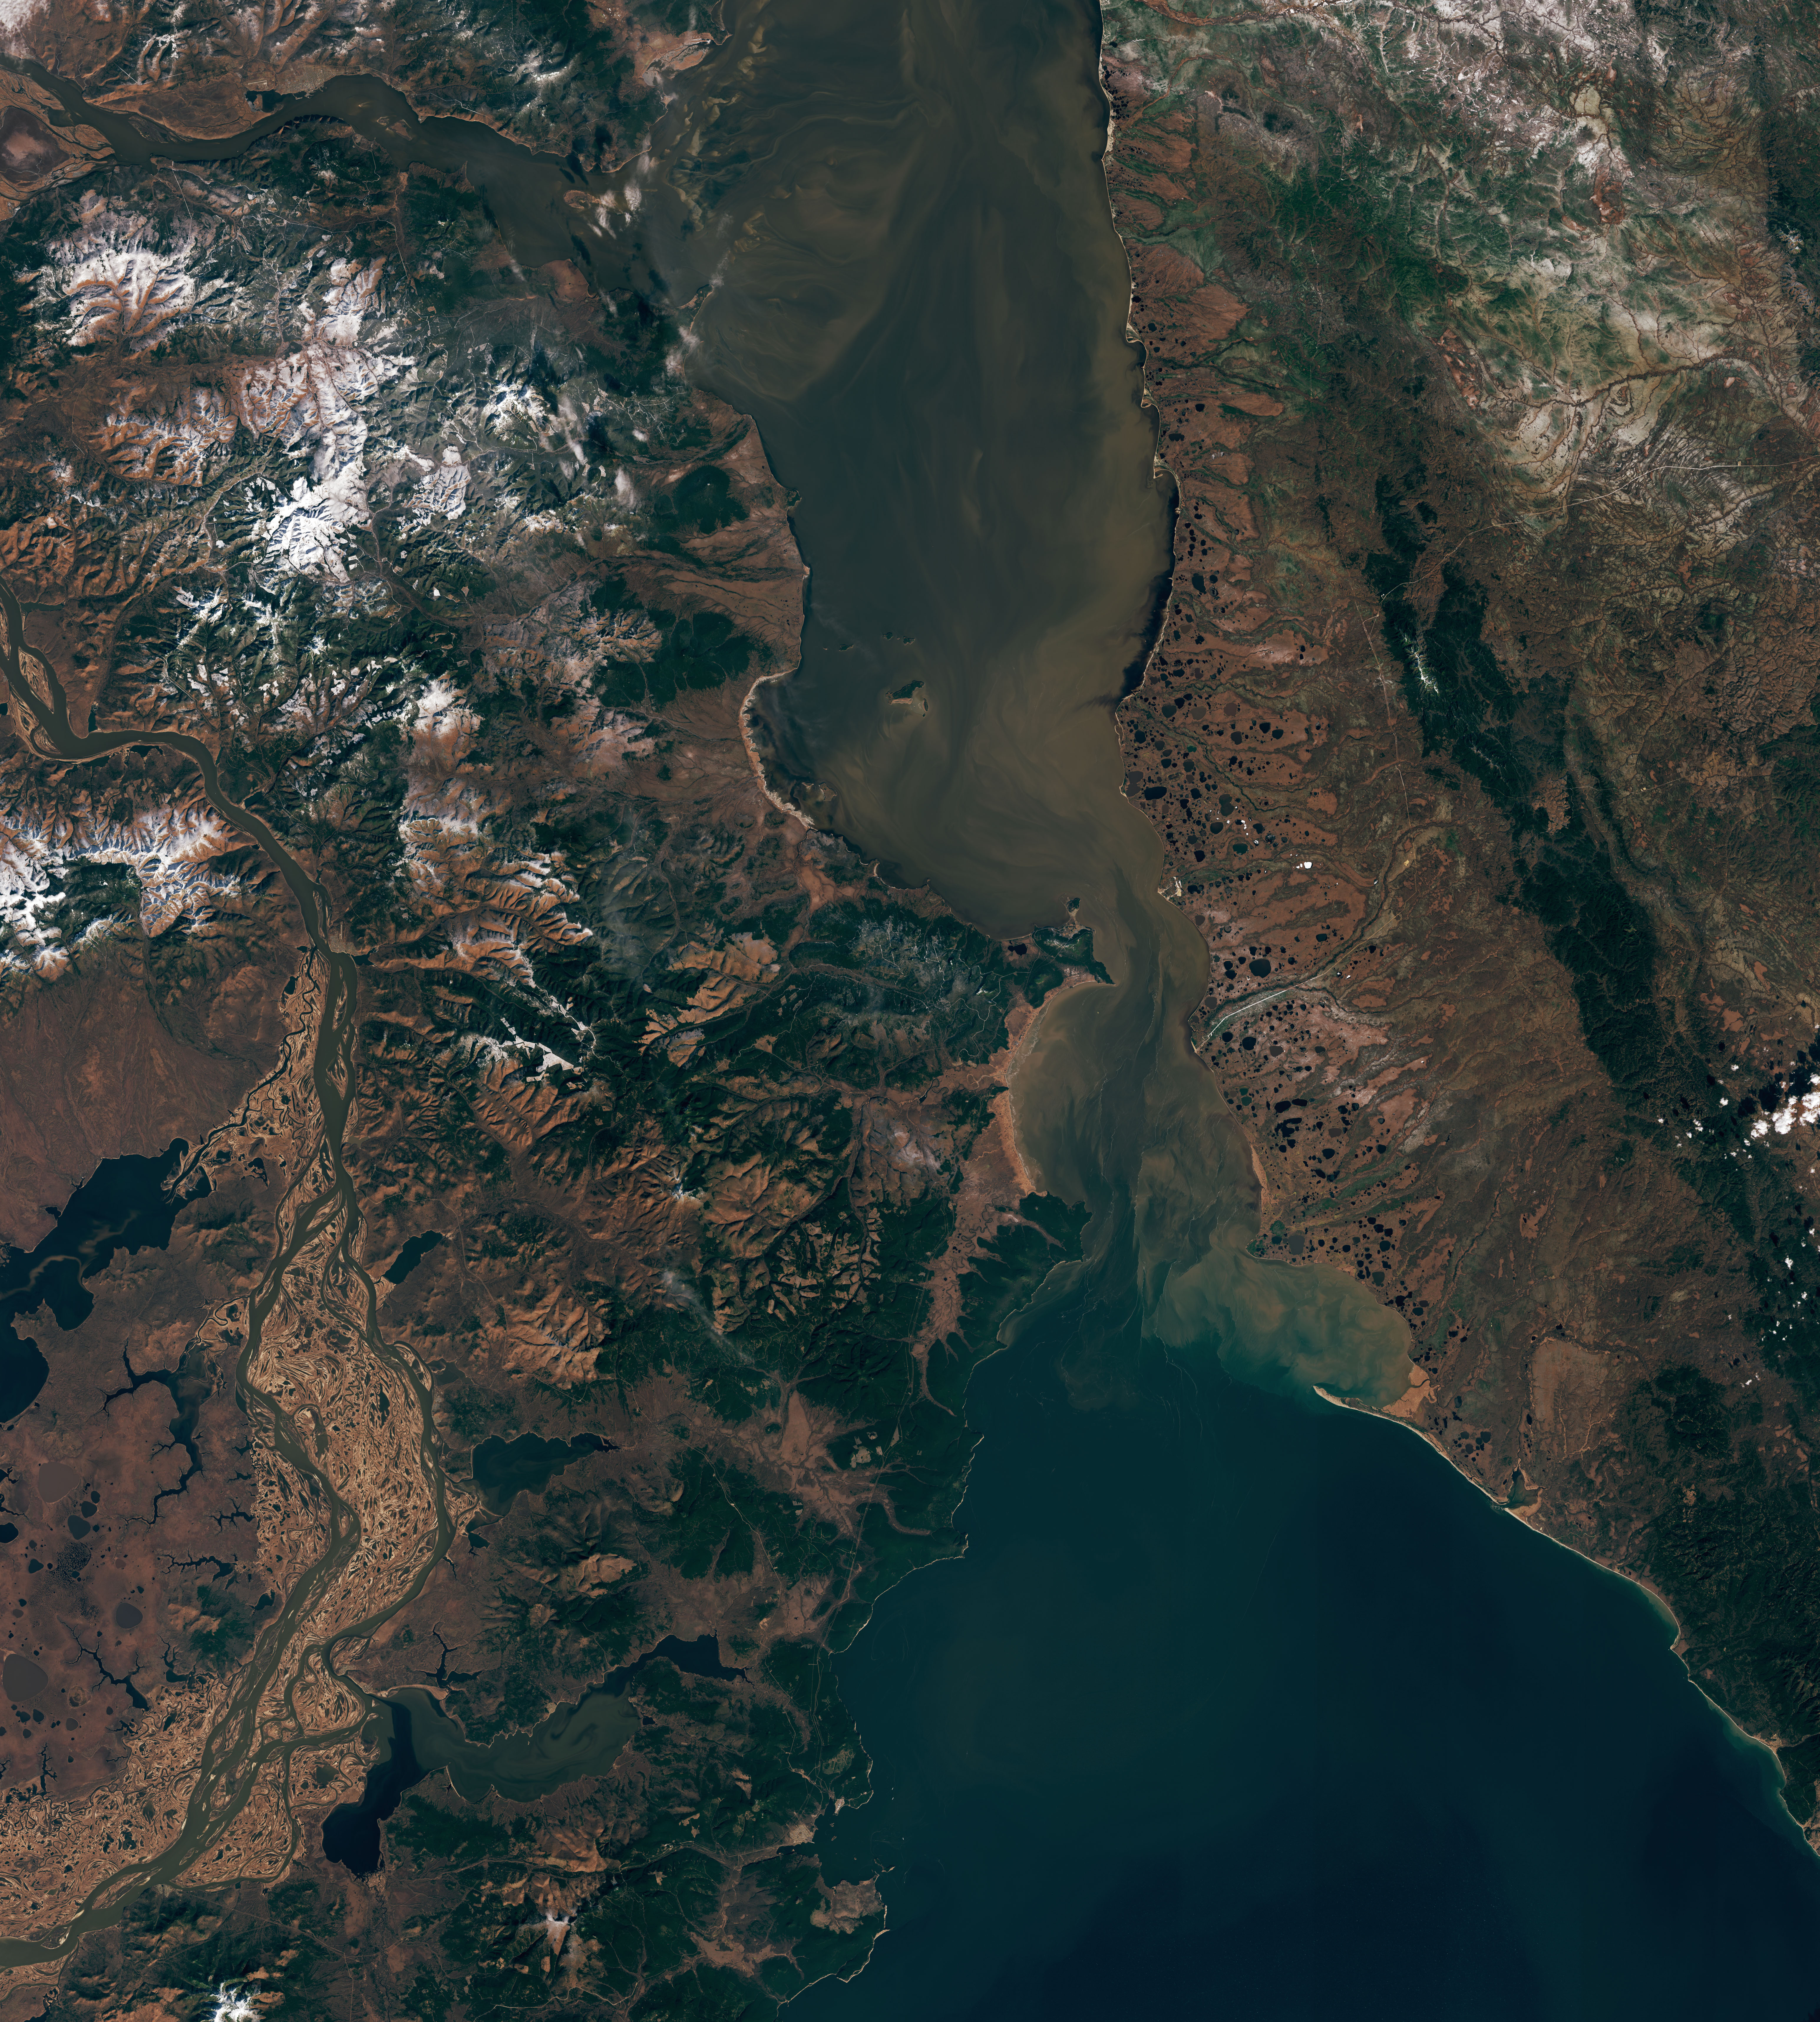
For about half the year, the Strait of Tartary in the Russian Far East is capped with ice. Just weeks before the waters began their seasonal freeze-up in November 2022, the Operational Land Imager-2 (OLI-2) on Landsat 9 acquired one of autumn’s last images of the strait’s colorful, dynamic waters.
The strait is sandwiched between mainland Russia and Sakhalin Island, and it connects the Sea of Japan with the Sea of Okhotsk. The northern part of the strait, also known as the Amur Liman, receives freshwater from the Amur River. The Amur is the world’s tenth-longest river, which flows east along the Chinese-Russian border before turning northeast and emptying into the strait.
Flooding is common along the river from spring through autumn. In the spring, melting snow and thawing soils lead to a surge of meltwater, or freshet. The surge of water carries sediments and organic materials into the strait, coloring its waters brown. A second pulse of water in summer and autumn comes from rainfall that accompanies the monsoon and sweeps more materials into the river and eventually into the strait.
When this image was acquired on October 25, 2022, the flooding season was coming to an end. Still, the mighty Amur River continued to deliver sediment and dissolved organic matter that likely contributed to the colorful waters visible in the image. Already, patches of snow were visible on the land—rebuilding a source of water for next year’s floods.
References
- Britannica Climate of the Amur River. Accessed November 17, 2022.
- MODIS Image of the Day (2020, September 16) Sediment in the Strait of Tartary. Accessed November 17, 2022.
- NASA Earth Observatory (2019, October 10) Autumn Along the Amur.
- Tachibana, Y. et al. (2008) Seasonal and interannual variations of Amur River discharge and their relationships to large-scale atmospheric patterns and moisture fluxes. JGR Atmospheres, 113, D16.
NASA Earth Observatory image by Lauren Dauphin, using Landsat data from the U.S. Geological Survey. Story by Kathryn Hansen.
This image record originally appeared on the Earth Observatory. Click here to view the full, original record.