Summer Melting in Svalbard
Downloads
- svarlbard_oli2_2022210_lrg.jpg (4717x5090, JPEG)
- svarlbard_oli2_2022210_detail.jpg (720x480, JPEG)
Metadata
- Sensor(s):
- Landsat 9 - OLI-2
- Data Date: July 29, 2022
- Visualization Date: August 4, 2022
This Image of the Day is the answer to the August 2022 puzzler.
Exceptionally warm air temperatures in summer 2022 have caused record melting across Svalbard. The abundant meltwater, much of which flowed to the ocean, is the latest expression of a rapidly warming climate in Norway’s ice-covered archipelago.
According to Xavier Fettweis, a climatologist at the University of Liège, the cumulative melting across Svalbard between June 1 and July 31, 2022, was 1.5 times larger than the previous record in 2018. Since the start of summer, he noted, about 40 gigatons (44 billion U.S. tons) of meltwater has poured into the ocean.
“The melt anomaly is 3.5 times larger than the 1981–2010 average, and 5 times the interannual variability,” Fettweis said. “Only a changing climate can explain this.”
Located halfway between Norway’s mainland and the North Pole, Svalbard is one of the fastest warming places on the planet. More than half of its land area is covered with ice, representing about 6 percent of planet’s glaciated area outside of Greenland and Antarctica.
Even before the record melting, warming was already changing the landscape. Glaciers have been retreating, and a surface layer of compressed porous snow, known as “firn,” has been losing its capacity to store much meltwater.
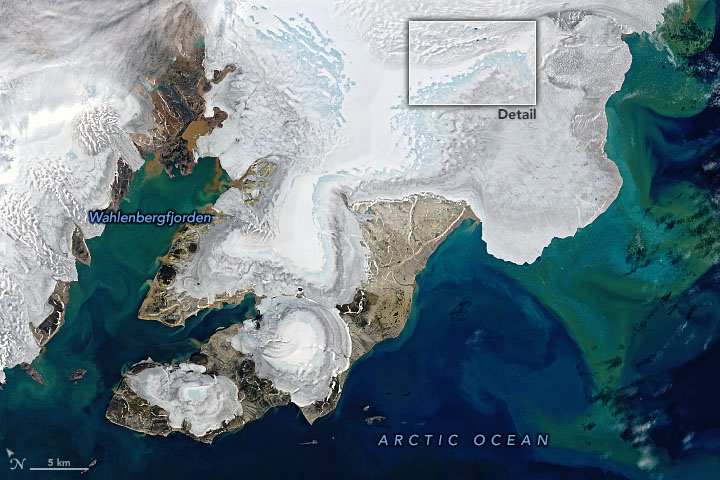
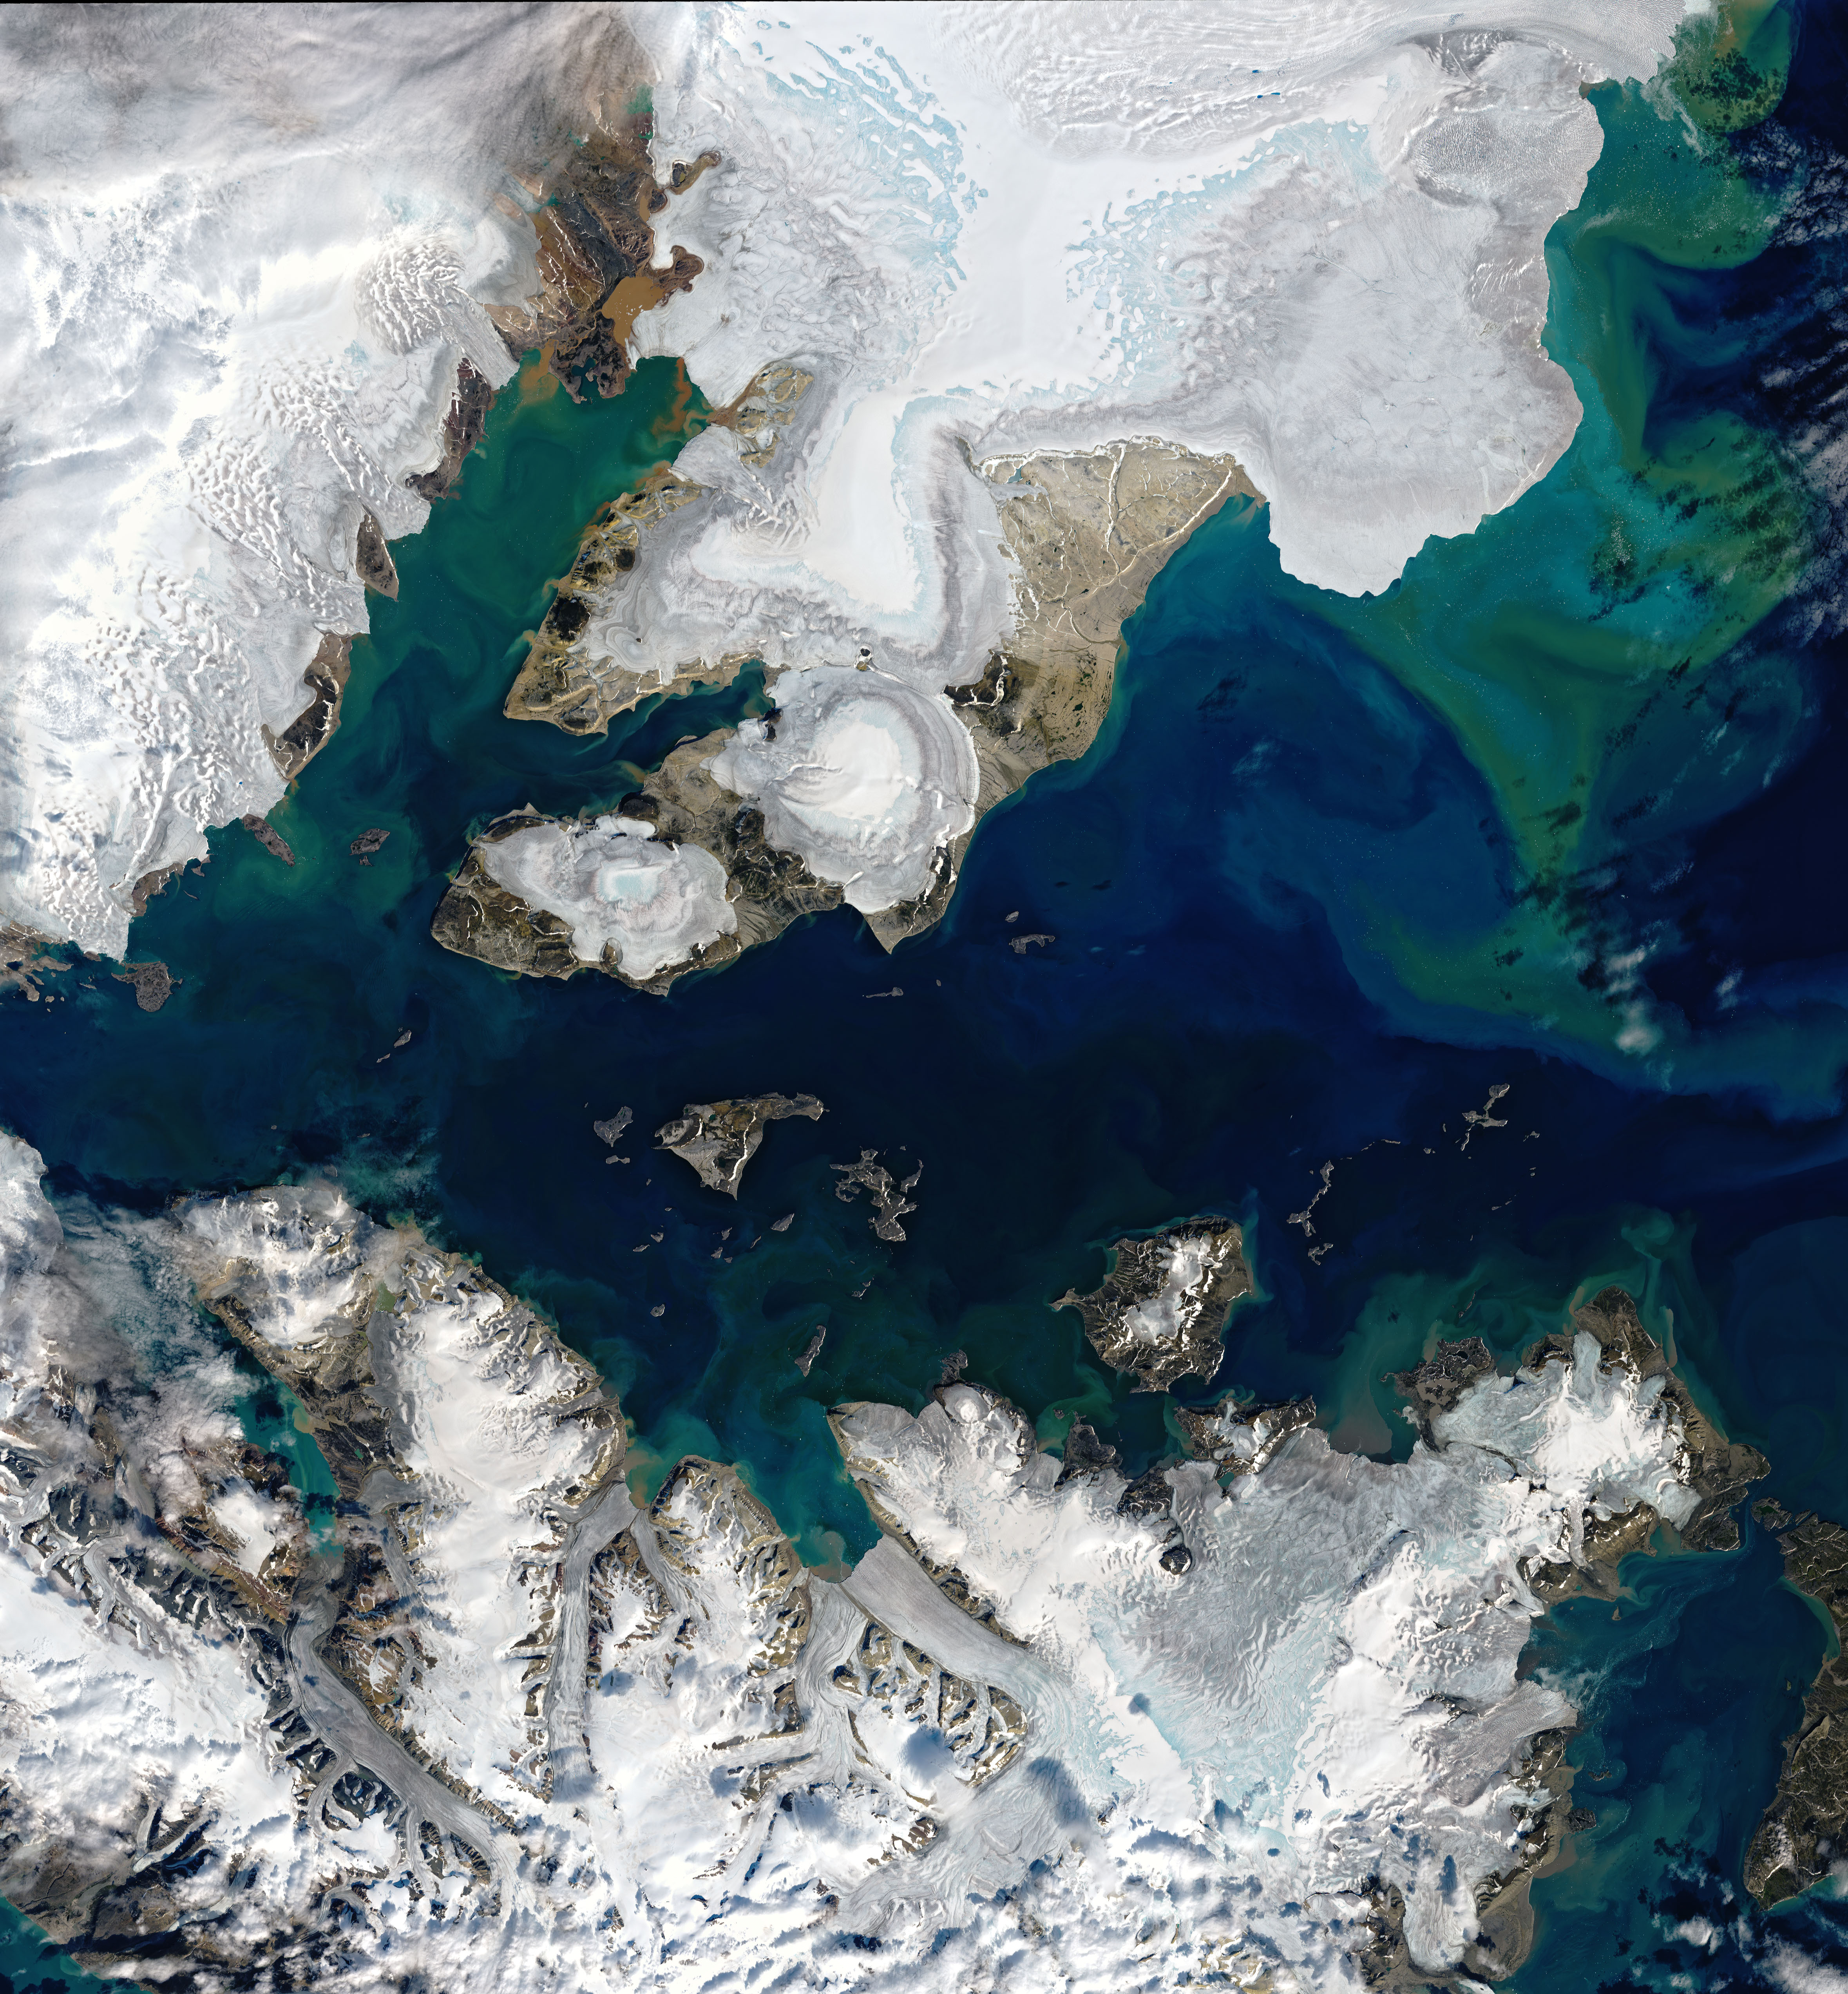
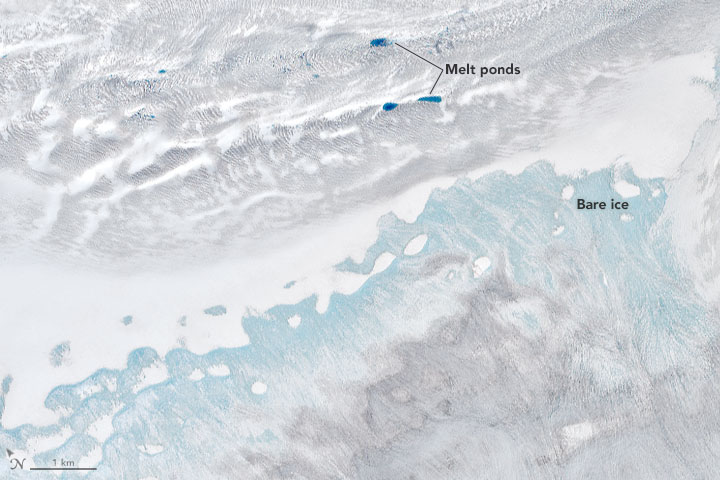
The excessive warmth in summer 2022 has taken a visible toll. These natural-color images, acquired on July 29, 2022, by the Operational Land Imager-2 (OLI-2) on Landsat 9, show a portion of Nordaustlandet—a major island in northeast Svalbard. Notice the extensive light-blue areas where snow and firn have melted away and exposed bare ice. The detailed image (below) shows several dark-blue melt ponds, where meltwater has pooled on the surface of the ice cap.
Offshore, some of the colorful water is likely due to sediments that were eroded by the flow of ice over bedrock, and then carried by meltwater into the waters of Wahlenbergfjorden and the adjacent Arctic Ocean. There might also be phytoplankton present, which can color the water turquoise-blue and green.
The melting this summer was caused by persistent warm winds blowing from the south. From May 1 through July 25, 2022, parts of the archipelago saw air temperatures that averaged up to 1.8°C (3.2°F) higher than usual. A significant pulse of warm air starting on July 15 produced Svalbard’s highest recorded melt volume on July 17.
Other factors also contributed to the record melting, Fettweis explained. First, sea ice retreated from the archipelago earlier than usual, exposing open ocean water by the end of spring 2022. (Sea ice can sometimes persist into late summer). This allowed warm southerly winds to reach land without first being chilled by blowing over sea ice. Also, little snow fell during the 2021–2022 winter. The thin layer of fresh snow quickly melted as temperatures warmed, exposing large swaths of darker, older snow, firn, and bare ice. Compared with bright, new snow, these darker surfaces absorb more energy from the Sun, which amplifies melting during the Arctic’s long sunlit days.
In the past, much of the meltwater would have been stored within the layer of firn, where the water eventually refreezes. The process helps prevent meltwater from flowing into the ocean and can help preserve glacial ice. According to Fettweis, between 1981–2010, Svalbard’s snowpack retained about 34 percent of the summer meltwater. This summer, he said, only 8 percent was retained.
Over the past decade, mass losses from melting and runoff have outpaced accumulations from rain and snow. “Svalbard is now losing more ice than it is gaining,” Fettweis said, “and it is clear that this trend will continue in the future.”
References
- The Conversation (2020, September 23) Svalbard glaciers lost their protective buffer in the mid-1980s and have been melting ever since. Accessed August 4, 2022.
- Kavan, J. et al. (2022) Estimating Suspended Sediment Fluxes from the Largest Glacial Lake in Svalbard to Fjord System Using Sentinel-2 Data: Trebrevatnet Case Study. Water, 14 (12), 1840.
- Lang, C. et al. (2015) Future climate and surface mass balance of Svalbard glaciers in an RCP8.5 climate scenario: a study with the regional climate model MAR forced by MIROC5. The Cryosphere, 9, 945–956.
- NASA Earth Observatory (2018, June 25) Losing Ice in Svalbard.
- National Snow & Ice Data Center (2020, August 1) Heat Ripple. Accessed August 4, 2022.
- Nöel, B. et al. (2020) Low elevation of Svalbard glaciers drives high mass loss variability. Nature Communications, 11, 4597.
- University of Liège Real-time state of the 2021-2022 Arctic ice caps surface mass balance as simulated by the regional climate model MAR. Accessed August 4, 2022.
- Utrecht University (2020, September 14) Svalbard glaciers much more vulnerable to warming since mid-1980s. Accessed August 4, 2022.
- Wouters, B. et al. (2019) Global Glacier Mass Loss During the GRACE Satellite Mission (2002-2016). Frontiers in Earth Science, 7, 96.
NASA Earth Observatory images by Joshua Stevens, using Landsat data from the U.S. Geological Survey. Story by Kathryn Hansen with science review by Xavier Fettweis/U. Liège, and Christopher Shuman/NASA/UMBC.
This image record originally appeared on the Earth Observatory. Click here to view the full, original record.