Kjer Glacier, Then and Now
Downloads
- baffinbay_etm_2000247_lrg.jpg (5910x5564, JPEG)
- baffinbay_oli_2021264_lrg.jpg (5910x5564, JPEG)
Metadata
- Sensor(s):
- Landsat 7 - ETM+
- Landsat 8 - OLI
- Data Date: September 3, 2000 - September 21, 2021
- Visualization Date: November 5, 2021
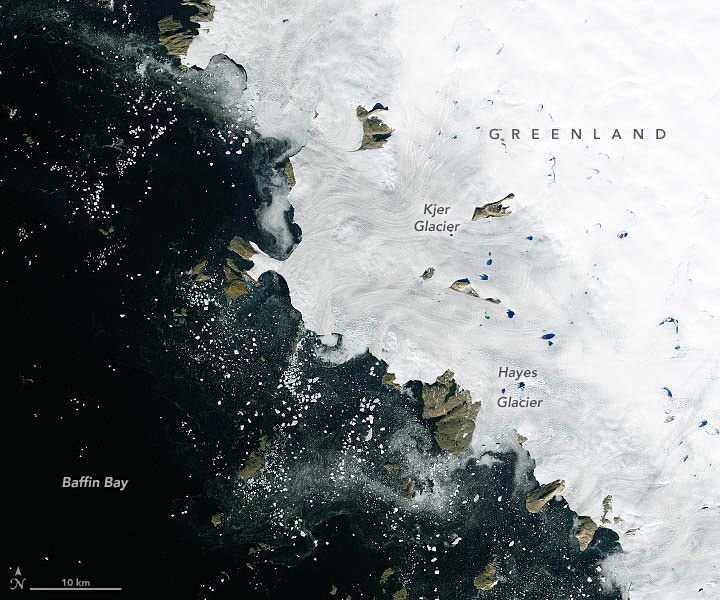
Change is constant and common on Earth across geologic time. But in the icy polar regions, change has been dramatic and swift in the past few decades. One example is northwest Greenland, where quite a lot has changed in 21 years.
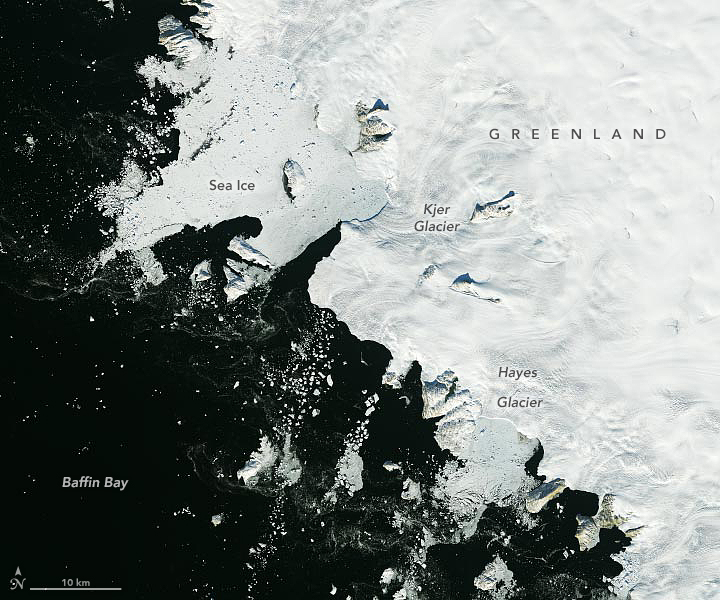
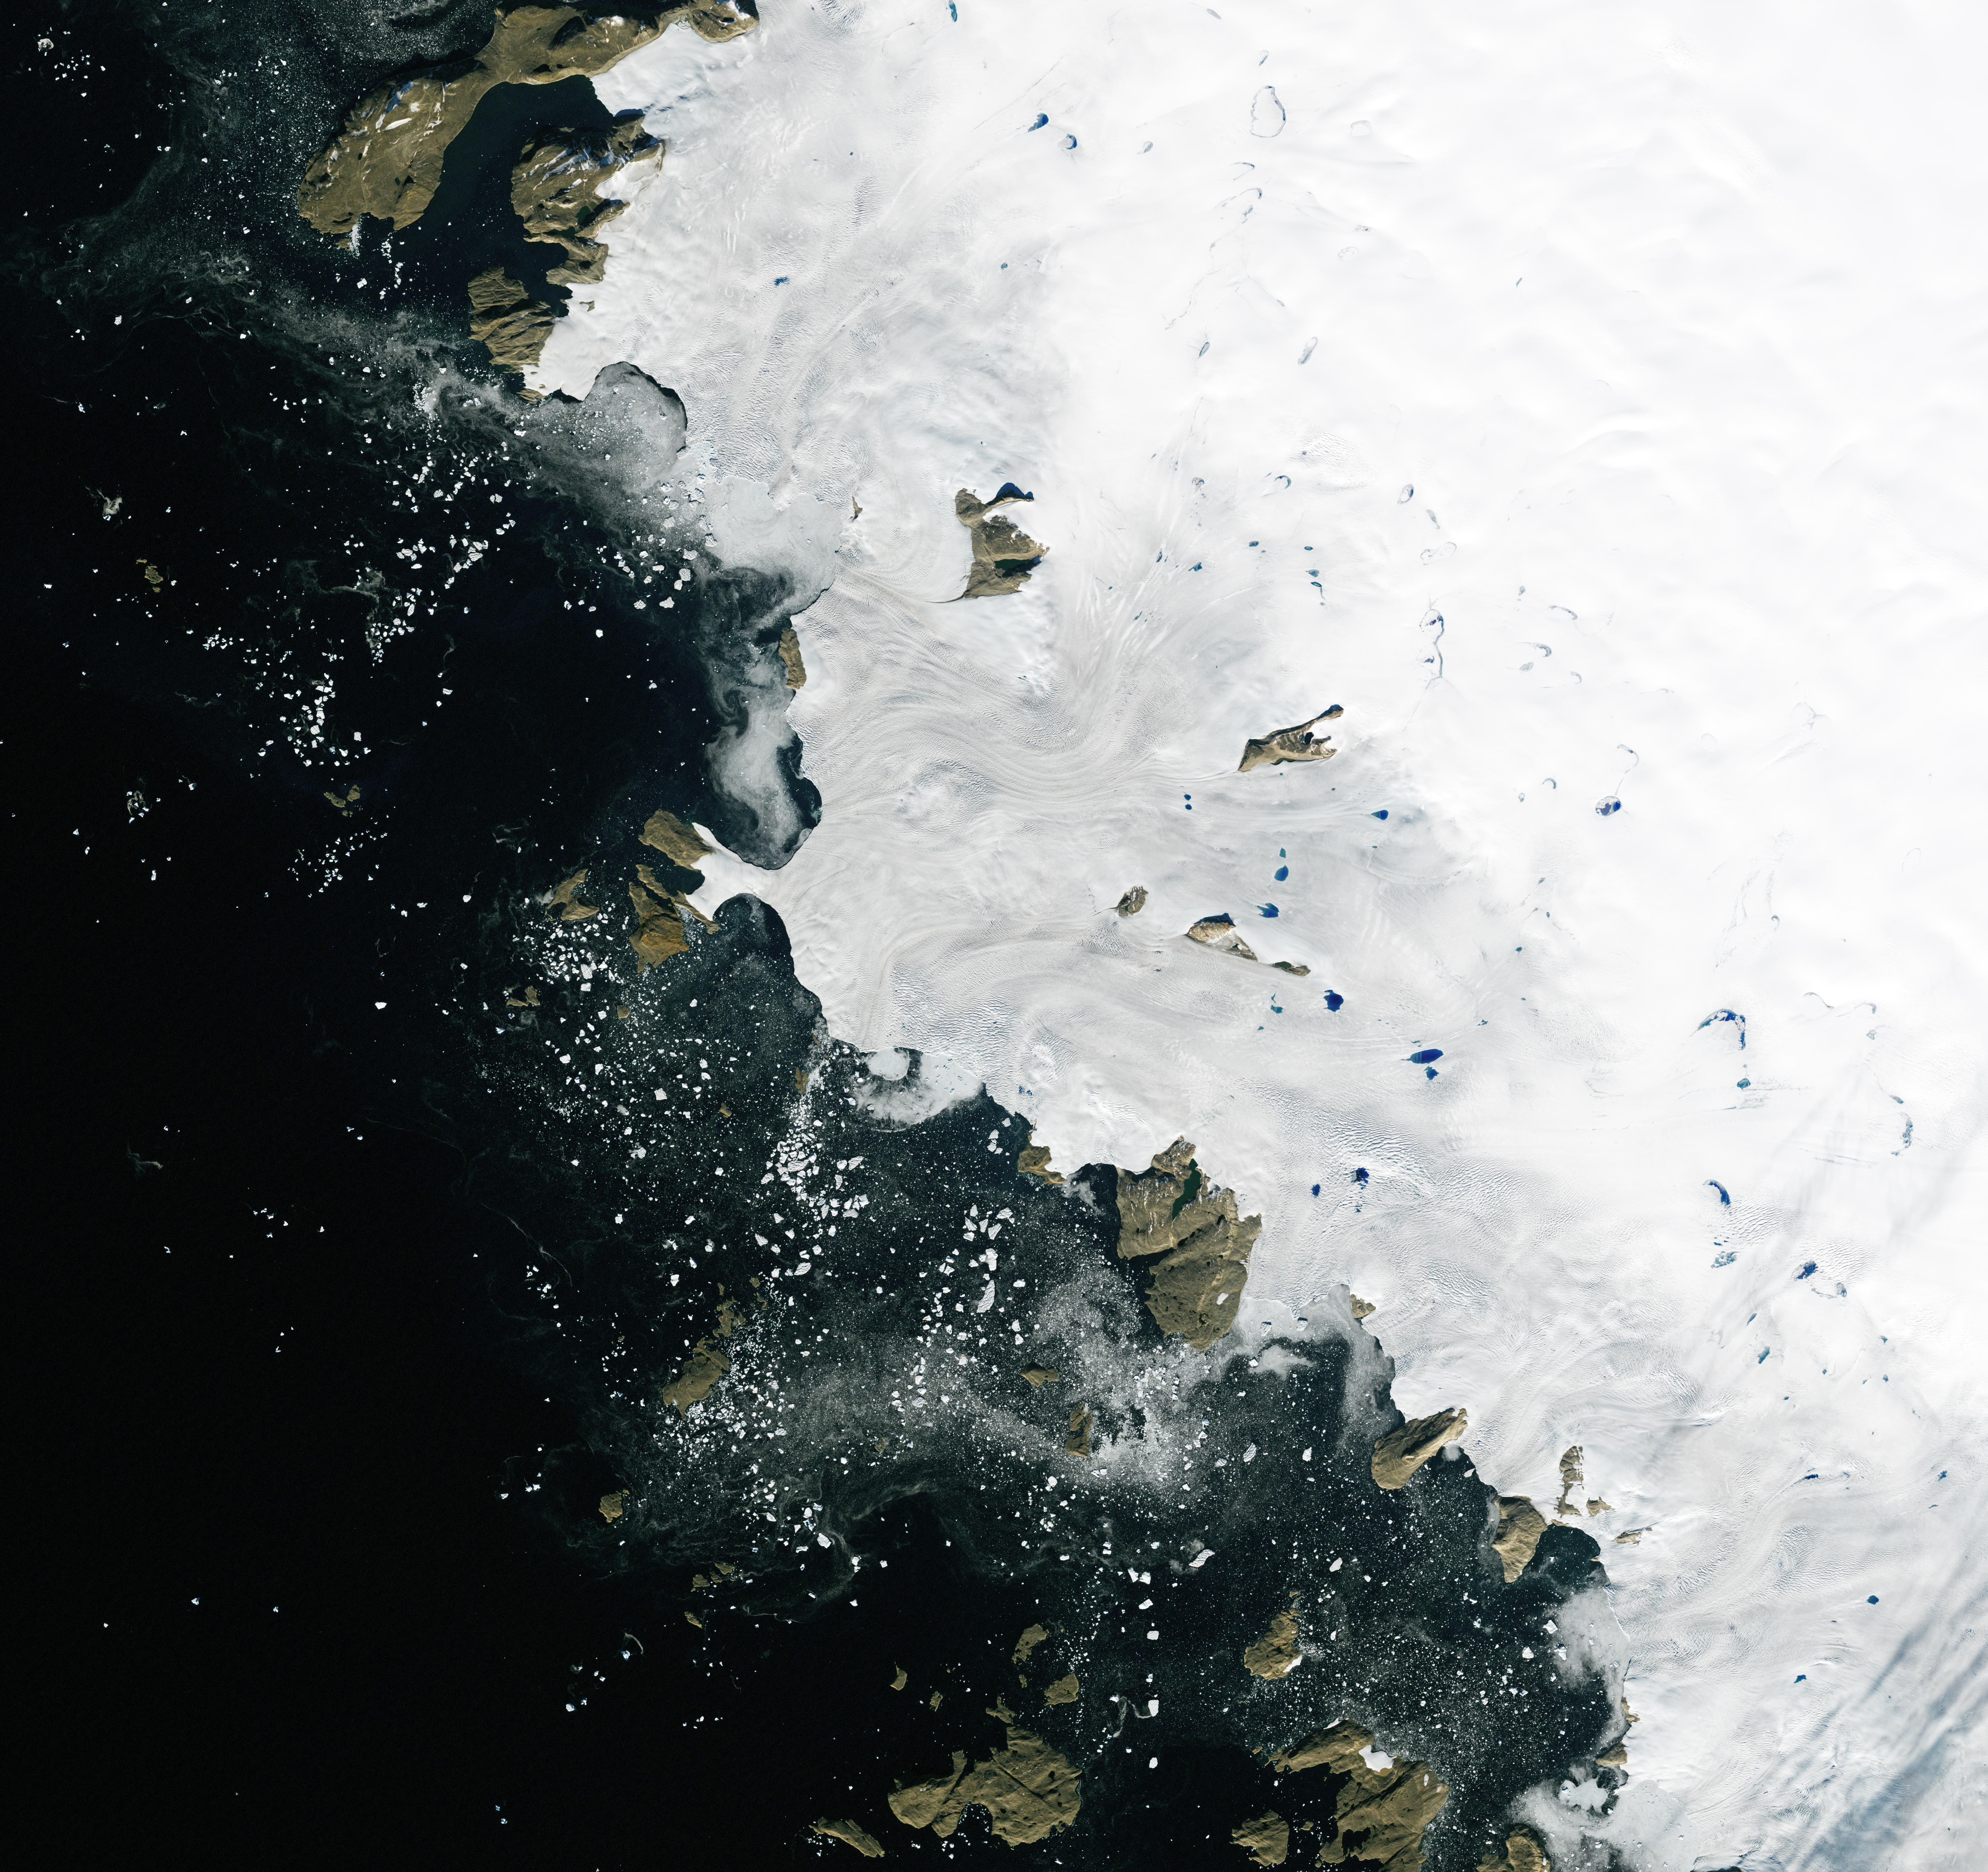
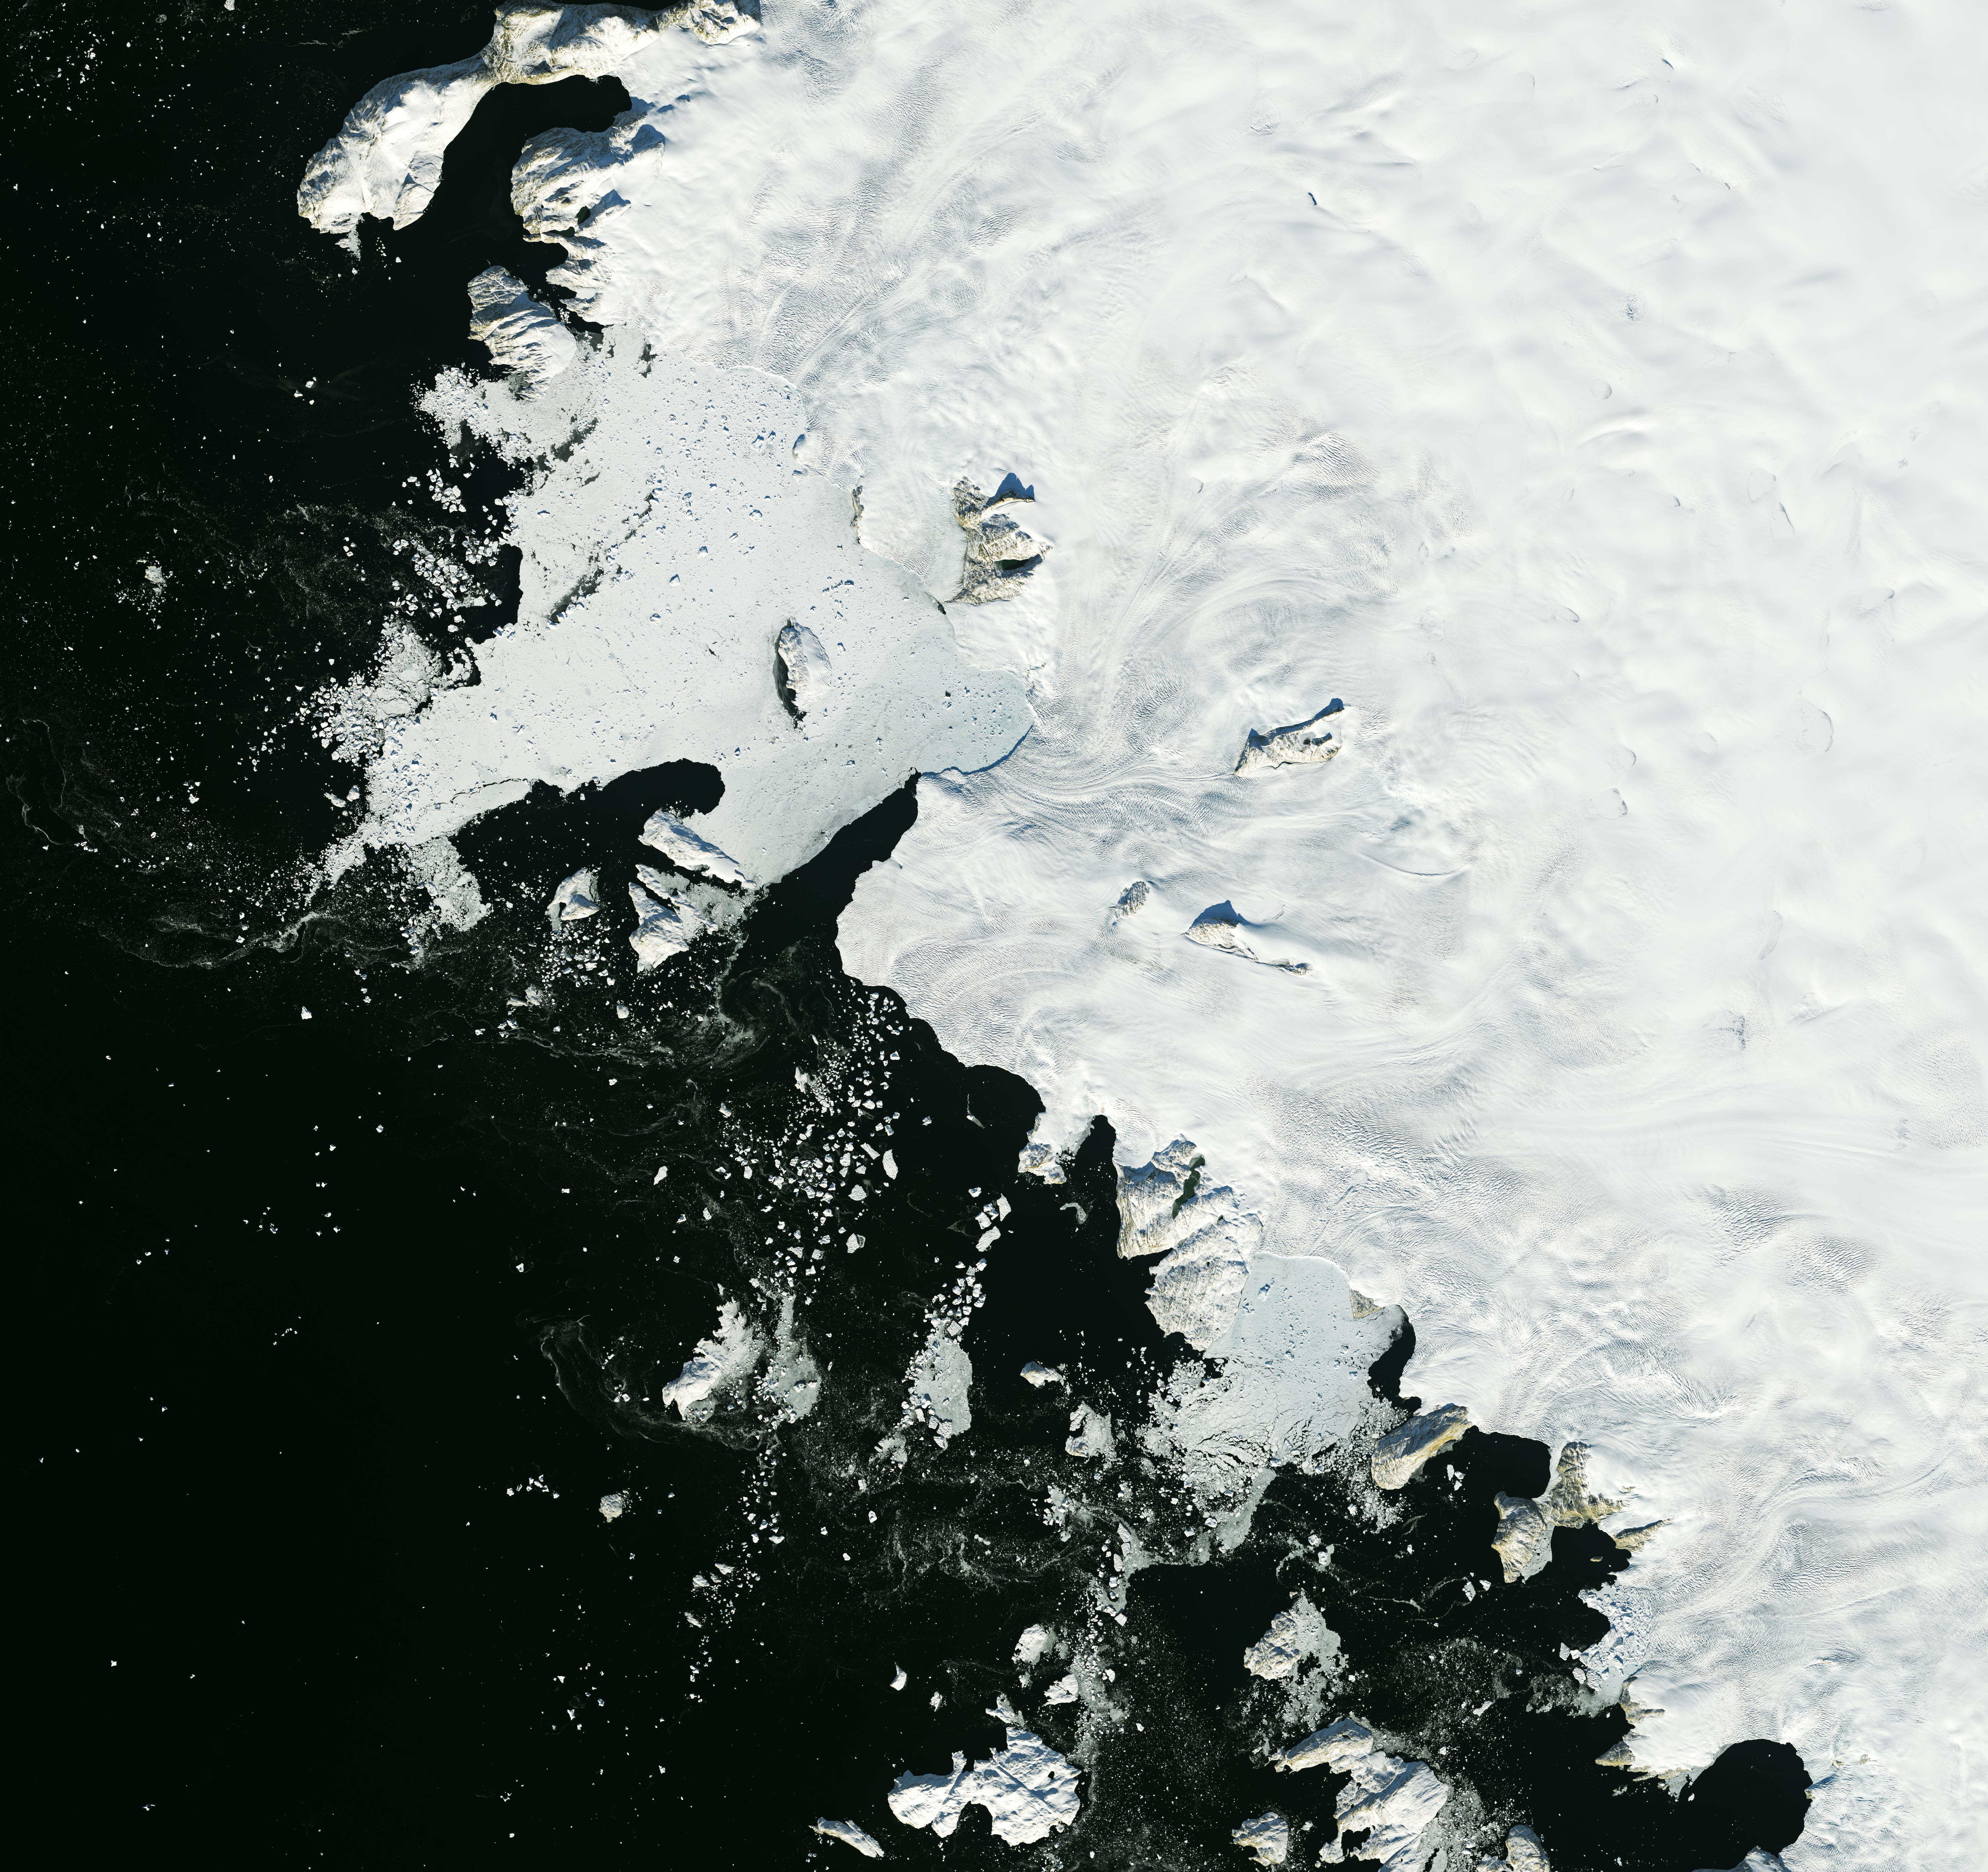
The image pair above shows part of Greenland along Melville Bay (a sub-section of Baffin Bay) on September 3, 2000, and September 21, 2021. The images were acquired with the Enhanced Thematic Mapper Plus (ETM+) on Landsat 7 and the Operational Land Imager (OLI) on Landsat 8, respectively. (Note that Earth Observatory originally published a version of the 2000 image in false color. Both images above are natural color and show a slightly wider view.)
The images show a 80-kilometer (50-mile) stretch of coastline. Like so many places around the edges of Greenland, a series of glaciers here carry ice from the island’s interior toward the coast and onto the ocean. Most of these marine-terminating glaciers are retreating. Kjer and Hayes—the two main outlet glaciers shown above—are also speeding up.
Notice that in 2000, Kjer Glacier abutted a few rocky outcrops. These rocks helped buttress the ice and slowed its oceanward flow. Then sometime in 2012, the glacier’s floating ice shelf disintegrated. The rocks became free-standing islands, surrounded in the 2021 image by open water and a mixture of sea ice and icebergs, or mélange. Having lost contact with the rocks, the glacier’s inland ice can flow even more rapidly toward the ocean.
According to Alex Gardner, a snow and ice scientist at NASA’s Jet Propulsion Laboratory, data from the NASA MEaSUREs project ITS_LIVE show that one year before the ice shelf’s breakup, the glacier flowed at an average speed of 1,200 meters per year. By 2018, the glacier’s average speed was more than 4,000 meters per year.
“Kjer is experiencing a nearly four-fold increase in ice flow due to the collapse of its floating ice shelf, likely due to melting by warmer ocean waters,” Gardner said. “This has led to increased contributions of ice to the ocean and is accelerating sea level rise.”
In the 1970s, the Greenland Ice Sheet gained about as much ice as it lost—a balanced state that lasted until the mid 1990s, at which point ice loss sped up. Between 2002 and 2021, Greenland shed about 280 gigatons of ice per year, adding 0.8 millimeters (0.03 inches) per year to global sea level rise.
References
- Moon, T. A. et al. (2020) Rapid Reconfiguration of the Greenland Ice Sheet Coastal Margin. Journal of Geophysical Research: Earth Surface, 125 (11), e2020JF005585.
- NASA (2020, September 20) Baffin Bay, Greenland: A Historical Perspective. Accessed November 5, 2021.
- NASA Earth Observatory (2002, June 24) Baffin Bay, Greenland.
- NASA’s Jet Propulsion Laboratory (2021) Greenland Ice Loss 2002-2021. Accessed November 5, 2021.
- Wood, M. et al. (2021) Ocean forcing drives glacier retreat in Greenland. Science Advances, 7 (1).
- Ziaja, W. and Ostafin, K. (2019) Origin and location of new Arctic islands and straits due to glacial recession. Ambio, 48 (119), 25–34.
NASA Earth Observatory images by Lauren Dauphin, using Landsat data from the U.S. Geological Survey. Story by Kathryn Hansen.
This image record originally appeared on the Earth Observatory. Click here to view the full, original record.