The Known Unknowns of Sea Level Rise
Downloads
- afsluitdijk_oli_2021167_lrg.jpg (3931x3931, JPEG)
- sacramentosanjoaquin_srtm_2000_lrg.jpg (8161x10778, JPEG)
- charlotte_whale_photo.jpg (720x266, JPEG)
Metadata
- Sensor(s):
- Landsat 8 - OLI
- Space Shuttle - SRTM
- Data Date: June 16, 2021
- Visualization Date: July 30, 2021
Editor’s Note: Be sure to read the preceding parts of the series for more background on the Charlotte Whale and sea level rise projections.
As ice sheets melted at the end of the last Ice Age, sea levels rose and an inland sea formed in New England and southeastern Canada. Whales swam in what is now central Vermont. Ten thousand years later, the atmosphere and oceans are warming rapidly and land ice at all latitudes is melting. Data collected by satellite altimeters over the past three decades show that global sea level has risen by an average of 3.4 millimeters per year and the rate is accelerating.
As global warming changes our planet, which coastlines are most and least vulnerable to sea level rise? Could new inland seas and waterways develop as they did thousands of years ago? Could Lake Champlain ever reconnect to the ocean and become the Champlain Sea again?
These are the types of questions that members of NASA’s sea level rise team work on. Through a series of individual research projects and collective consultation, scientists are deciphering clues about past sea level rise, gathering observations of present conditions from satellites, ships, and airplanes, and developing computer models to anticipate possible futures. While definitive answers about local sea levels remain a challenge, decades of research have made the global picture much clearer.
Nearly every coast on Earth will be affected by sea level rise, but the impacts will not be distributed evenly. According to the Intergovernmental Panel on Climate Change, low-lying areas such as river deltas, barrier islands, and island atolls will face the most immediate threats—especially in poorer countries and rural areas that lack the resources to construct coastal defenses. Infrastructure—levees, floods walls, dykes, and the like—offers some hope of holding water back and postponing the worst impacts. The value of such systems is apparent in some places that already sit precariously near or below sea level; for example, parts of the The Netherlands and the Central Valley in California.
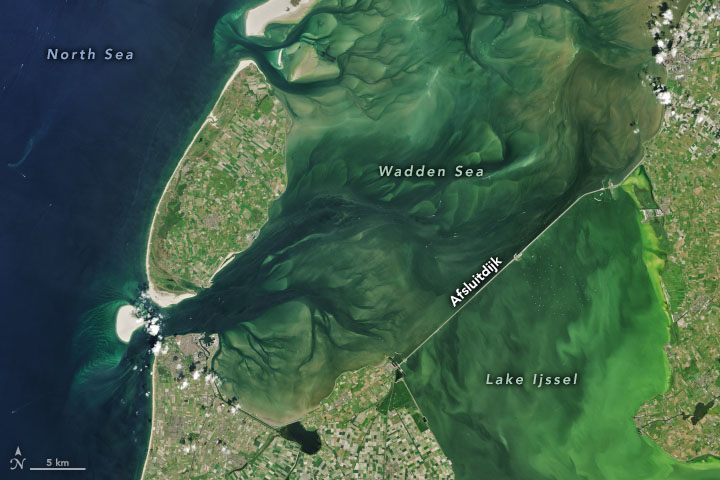
The Landsat 8 image at the top of the page shows the Afsluitdijk, a 32-kilometer (20-mile) dam that separates a shallow inlet of the North Sea (the Wadden Sea) from freshwater Lake Ijssel in the Netherlands. Without Afsluitdijk and the rest of the dams and dykes of the Zuiderzee Works, an inland sea would flood large patches of land around and within Lake Ijssel. To counter modern sea level rise, the Dutch are now making extensive upgrades to Afsluitdijk.
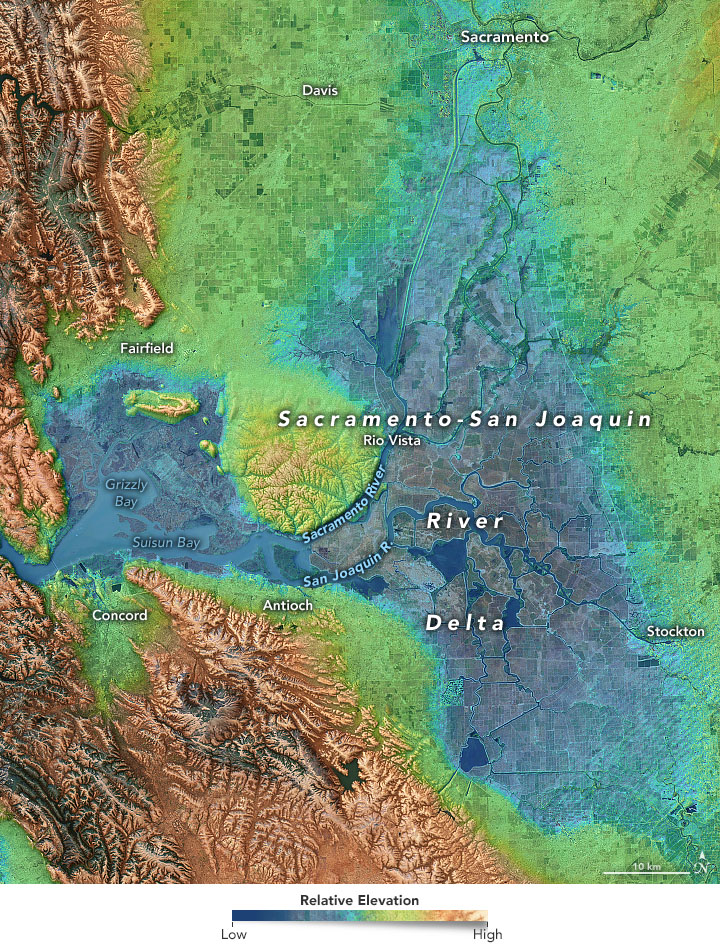
The Landsat 8 image and digital elevation model above highlights the vast network of levees that protect islands within the Sacramento-San Joaquin Delta. Many of the islands lie as much as 15 meters below sea level and would already be underwater without the levees. In the map, the lower elevation areas are shown in blue; higher elevation areas are green and brown.
“One of the reasons it is difficult to offer definitive assessments about how much sea levels will lead to impacts in certain areas is that governments could respond and influence which areas will flood and which will not by building infrastructure,” said Ben Hamlington of the Jet Propulsion Laboratory and current leader of NASA’s sea level team. “In places like The Netherlands or the Sacramento-San Joaquin Delta, countering strategies have either already been implemented. Or it’s a good bet that dykes and other infrastructure will be built to prevent inland seas from forming where they otherwise might.”
Inundation is not the only threat from rising seas. In Northern California, brackish and fresh water from the delta clashes with salty water in an estuary called Suisun Bay. As sea level rises over time, the salty water will advance farther inland, forcing water managers to release more fresh water into the delta and further strain a water system that tens of millions of people rely on for drinking water and farm irrigation.
A more dramatic, but distant question also lurks: what happens if there is a large surge in sea level due to catastrophic losses of polar ice? One of the largest uncertainties in sea level rise projections relates to the stability of the vast ice sheets in Antarctica and Greenland. Scientists are particularly concerned about the West Antarctic Ice Sheet (WAIS), a huge slab of ice that already sits partially below sea level and rests on a bed that slopes downward toward the Southern Ocean. If the WAIS becomes unstable and slides into the sea, it would add roughly 3 meters to global sea levels.
Even such a dramatic rise would have different effects in different places. “Sea level would actually fall near Antarctica and rise much more near New York City because of a gravitational effect we call sea level rise fingerprints,” explained Eric Larour, a JPL scientist and member of the sea level rise team. The gravitational pull of huge masses of ice actually piles water up along the coastline. As the ice melts, the gravitational pull will weaken and the crust below the ice will rise, prompting sea levels to drop along the Antarctic coast rise in the opposite hemisphere.
“If you add in the isostatic rebound in formerly glaciated parts of Europe and North America, the issue becomes even more complex,” said paleoclimatologist Anders Carlson of the Oregon Glaciers Institute. “Throw in competing gravitational effects from the Greenland Ice Sheet, and you can start to see how we’re dealing with ‘known unknowns’ when we're making regional sea level rise projections.”

So could there be another Champlain Sea, with whales swimming in the interior of New England? It is theoretically possible, but quite unlikely anytime soon. Even if seas rise to the worst case projections—up to 6 meters by 2300—Lake Champlain now sits about 30 meters above sea level thanks to ongoing isostatic rebound from the end of the last ice age.
The Charlotte Whale fossil will likely stay dry in the geology museum at the University of Vermont and it is not likely to get any new relatives. But Vermont’s official state fossil remains a potent reminder of how much Earth’s lands and seas have changed and how much they might in the future.
References
- California Department of Water Resources (2019, September 17) Could Sea Level Rise Threaten the Water Coming Out of Some California Taps? Accessed August 2, 2021.
- Hamlington, B. et al. (2020) Understanding of Contemporary Regional Sea-Level Change and the Implications for the Future. Reviews of Geophysics, 58 (3), e2019RG000672.
- Intergovernmental Panel on Climate Change (2019) IPCC Special Report on the Ocean and Cryosphere in a Changing Climate. Accessed August 2, 2021.
- NASA Global Climage Change (2020) Sea Level 101, Part Two: All Sea Level is ‘Local’. Accessed August 2, 2021.
- NASA Earth Data (2020) Sea Level Change Data Pathfinder. Accessed August 2, 2021.
- NASA (2020) Sea Level Change: Observations from Space. Accessed August 2, 2021.
- NASA Jet Propulsion Laboratory (2015) The Fingerprints of Sea Level Rise. Accessed August 2, 2021.
- Robel, A. et al. (2019) Marine ice sheet instability amplifies and skews uncertainty in projections of future sea-level rise. PNAS, 116 (30), 14887-14892.
- University of Vermont The Charlotte Whale. Accessed August 2, 2021.
NASA Earth Observatory images by Joshua Stevens, using Landsat data from the U.S. Geological Survey and topographic data from the Shuttle Radar Topography Mission (SRTM). Photograph courtesy of Bill DiLillo/University of Vermont, Geology Department Perkins Museum of Geology. Story by Adam Voiland.
This image record originally appeared on the Earth Observatory. Click here to view the full, original record.
