Historic Floods in New South Wales
Downloads
- sydneyflooding_oli_202096_lrg.jpg (4163x4627, JPEG)
- sydneyflooding_oli_202182_lrg.jpg (4163x4627, JPEG)
- austfloodingzm_aria_202179_lrg.jpg (2966x1879, JPEG)
- austfloodingwide_aria_202179_lrg.jpg (1463x1540, JPEG)
- Australia_floods_Mar2021_v2.mp4 (MPEG)
Metadata
- Sensor(s):
- Landsat 8 - OLI
- Space Shuttle - SRTM
- GPM - IMERG
- Data Date: March 20, 2021 - March 23, 2021
- Visualization Date: March 24, 2021
Persistent, heavy rain fell for several days in early autumn in New South Wales, Australia, leading to the region’s worst flooding in six decades. The Australian Bureau of Meteorology reported that areas around Sydney and in the Hunter and Mid North Coast regions were drenched with 400 to 600 millimeters (16 to 24 inches) of rain across four days, with the most extreme totals approaching one meter.
Water levels rose to major flood levels along the Clarence, Gwydir, Mehi, Lower Hunter, Manning, and Colo rivers, among others. The Hawkesbury-Nepean River system around Sydney saw its highest crests since 1961. At least 40,000 people were evacuated and several died across New South Wales (NSW) state, while farmers suffered significant crop and livestock losses.
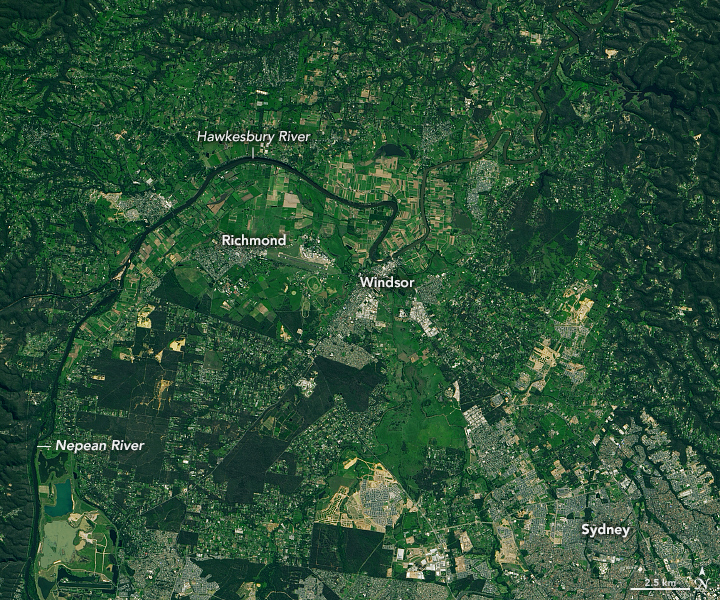
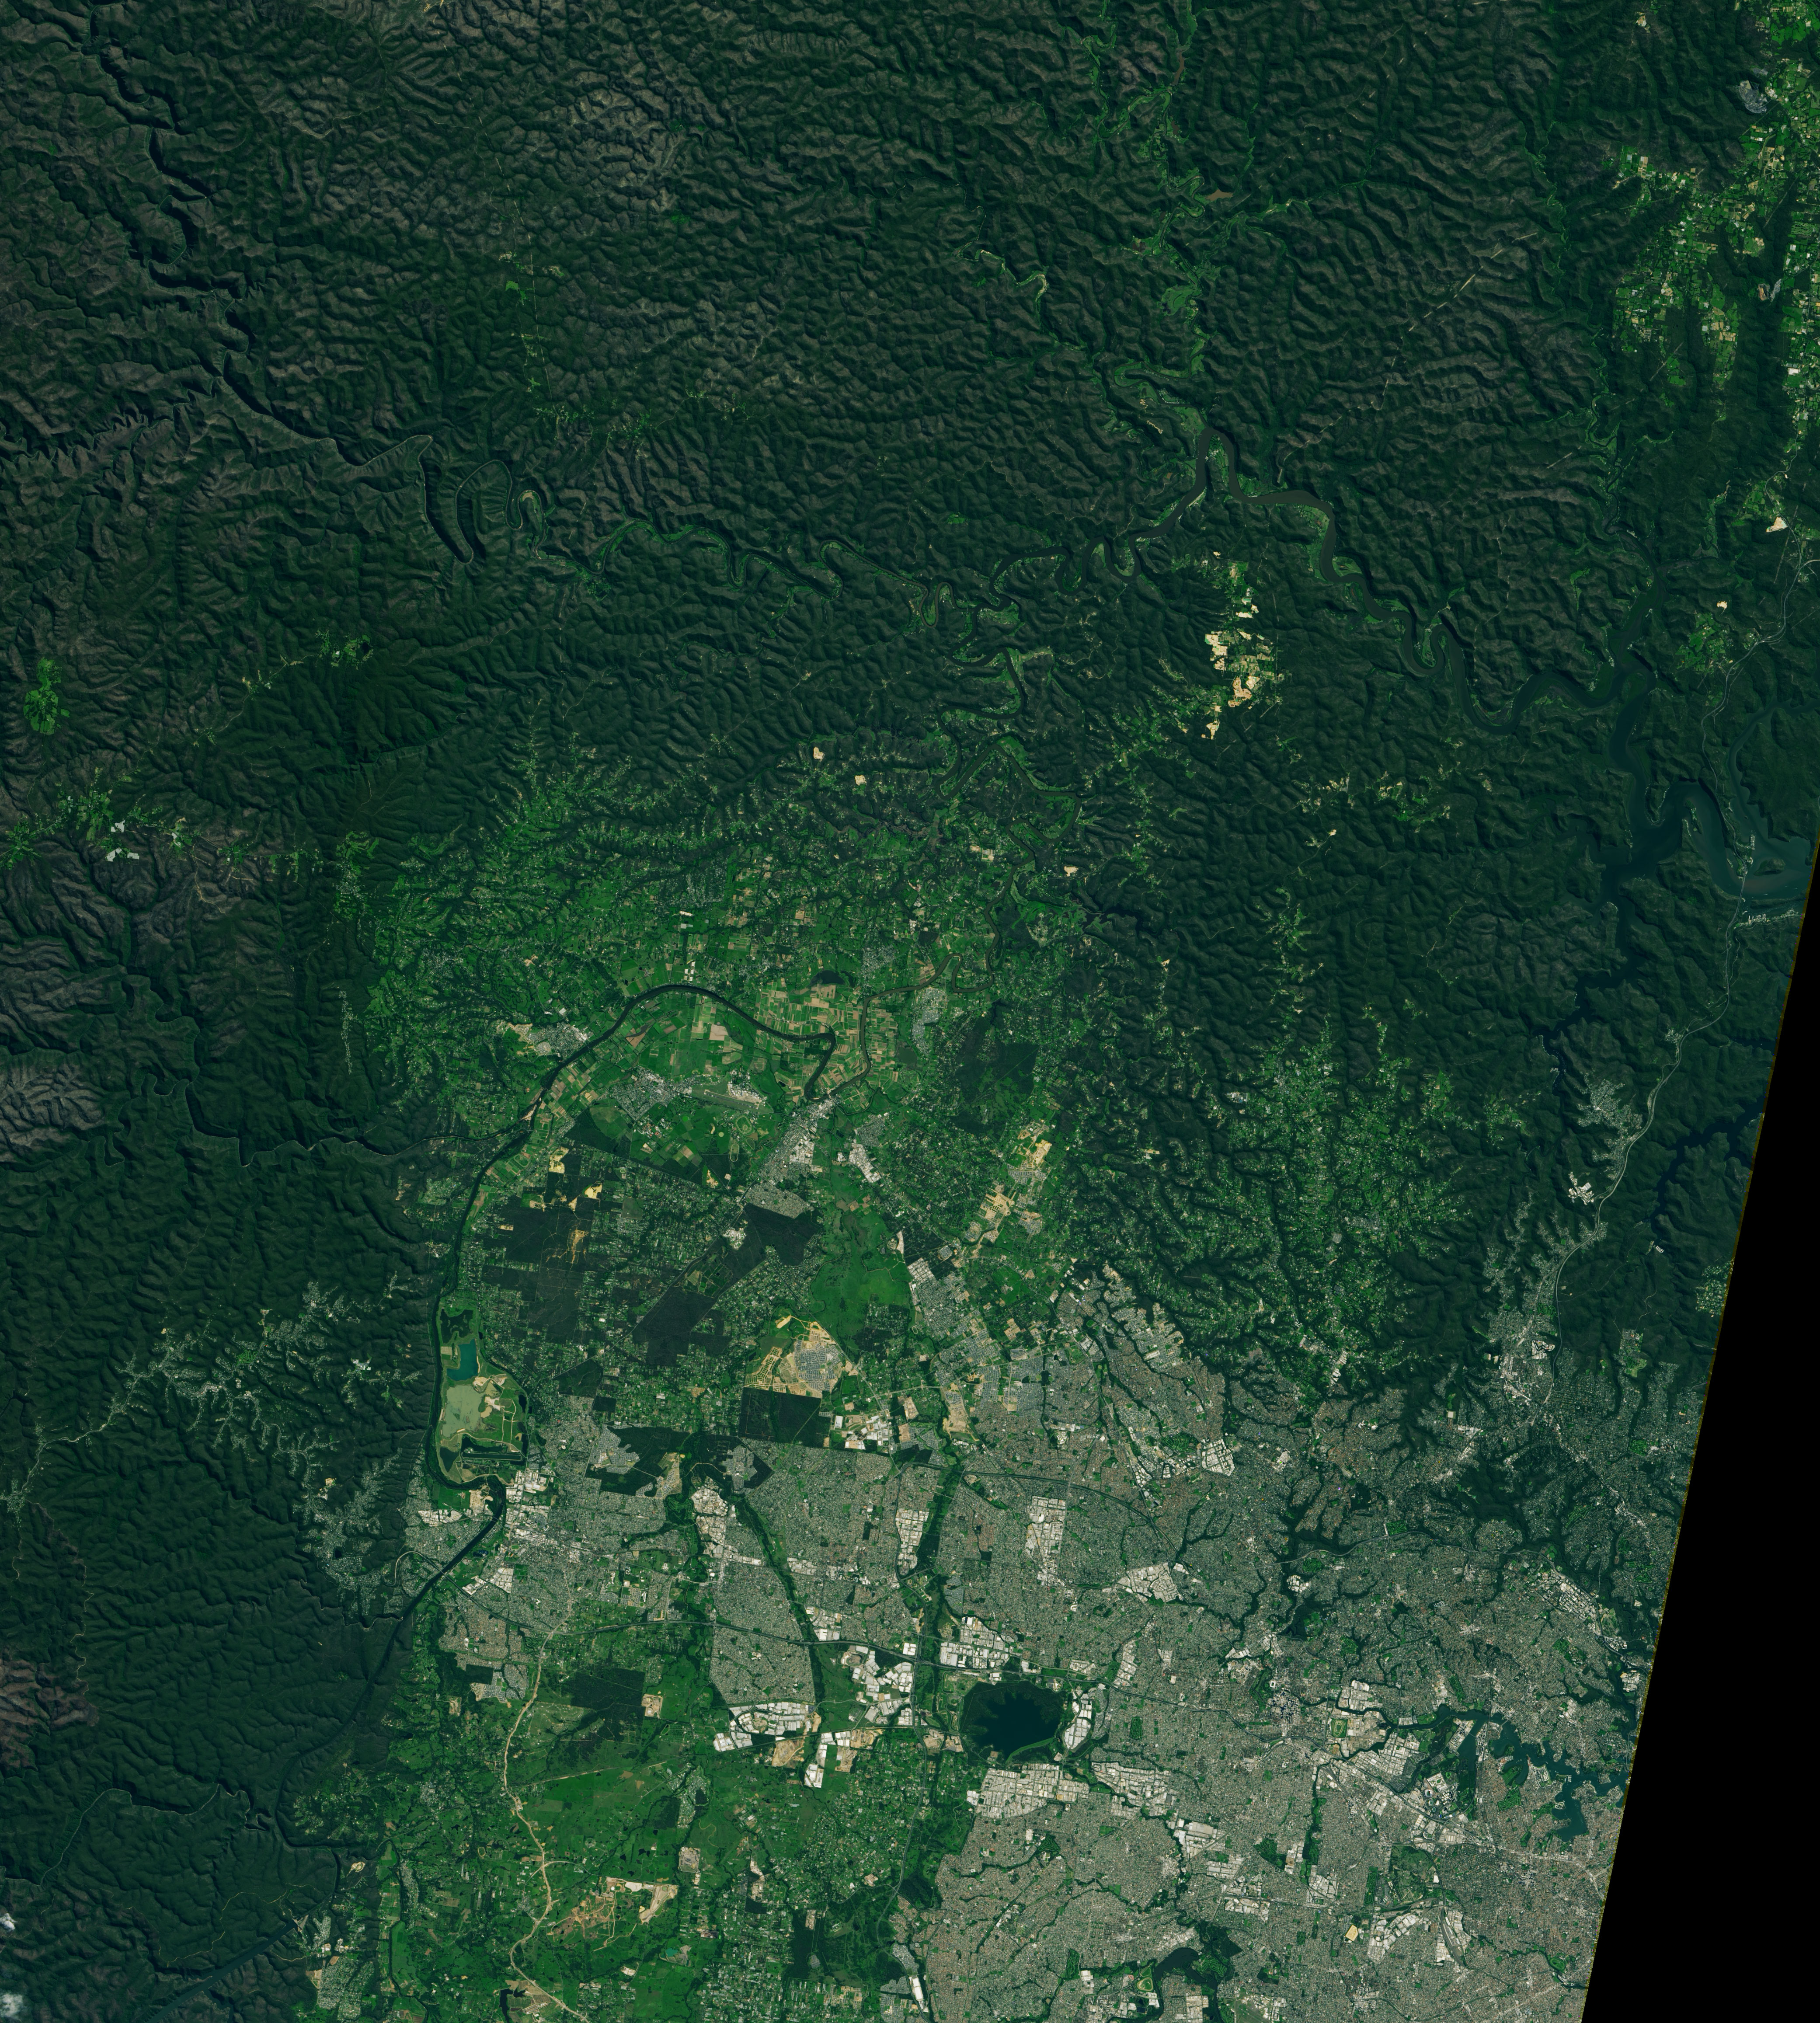
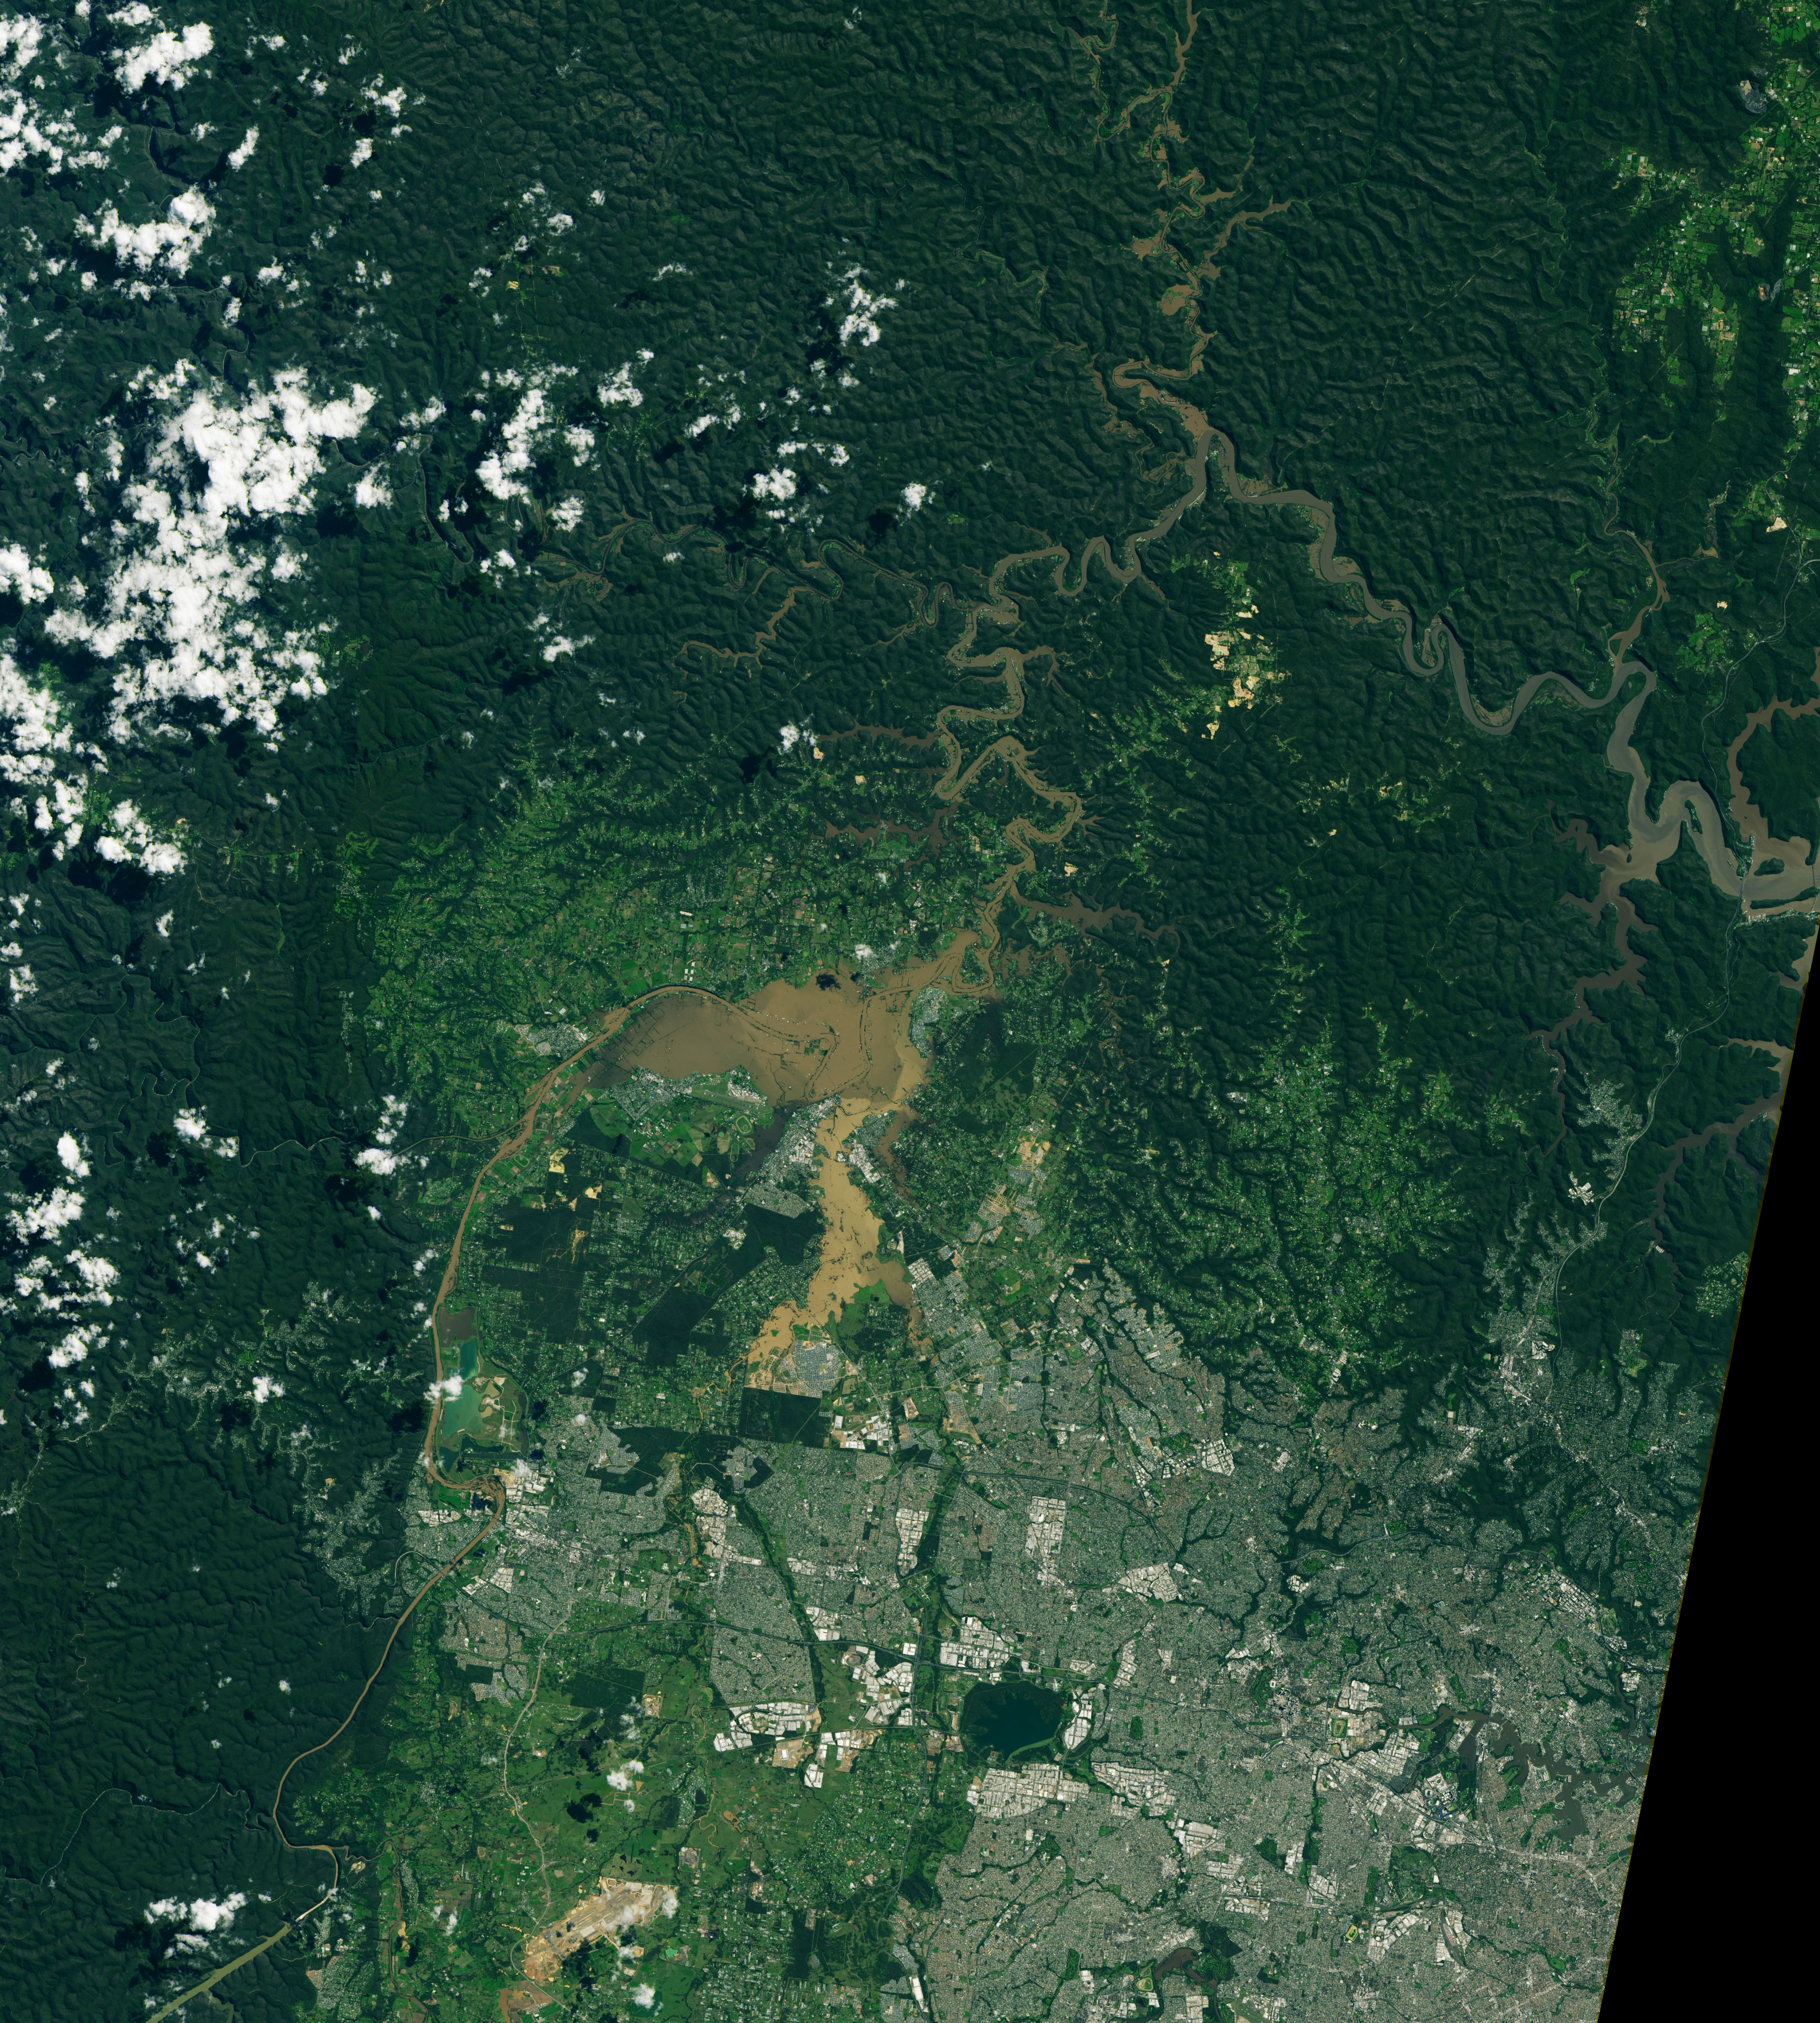
On March 23, 2021, the Operational Land Imager (OLI) on Landsat 8 acquired a natural-color image (above) of flooding in the Hawkesbury-Nepean River system along the western edge of Sydney. For comparison, the same area is shown on April 5, 2020.
Upstream from Sydney, the Warragamba Dam has been overflowing since March 20 and is expected to continue doing so for a week. The BBC reported: “Warragamba Dam discharged 500 gigalitres on Sydney—equivalent to the volume of Sydney Harbour.” The downstream Hawkesbury-Nepean valley has several choke points that cause river water to pile up and rise onto floodplains west of Sydney in what emergency management authorities refer to as a bathtub effect.
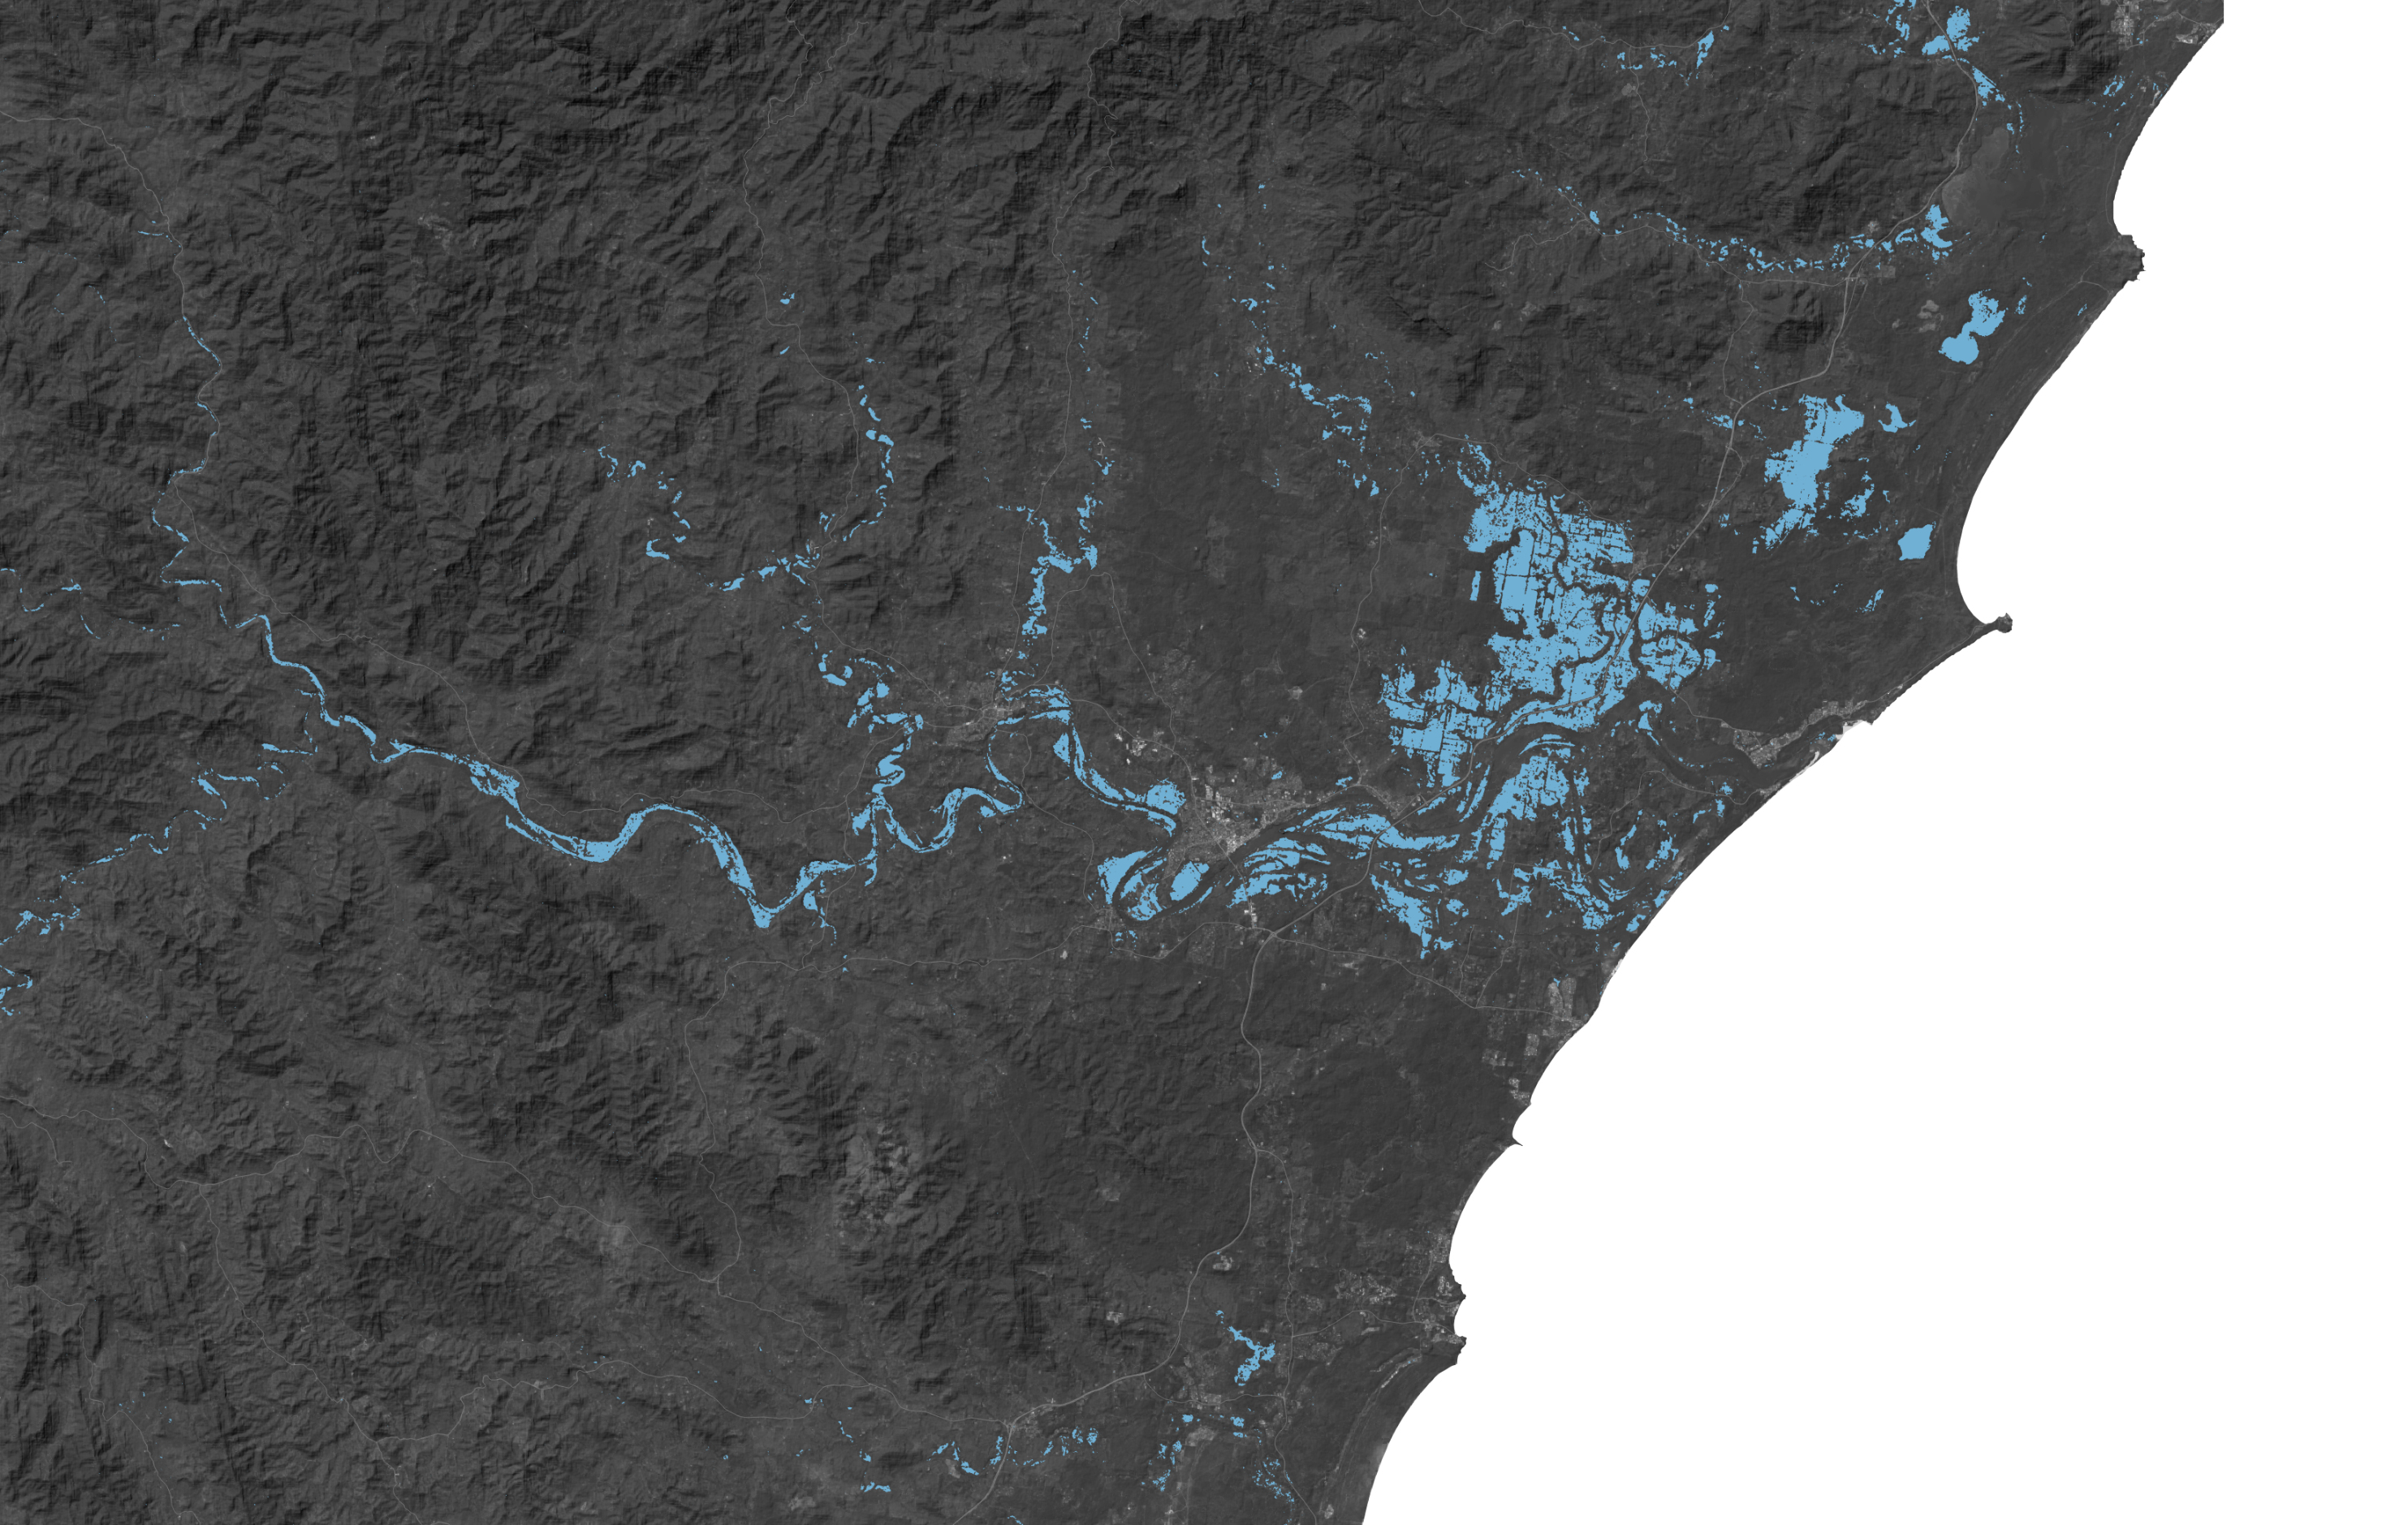
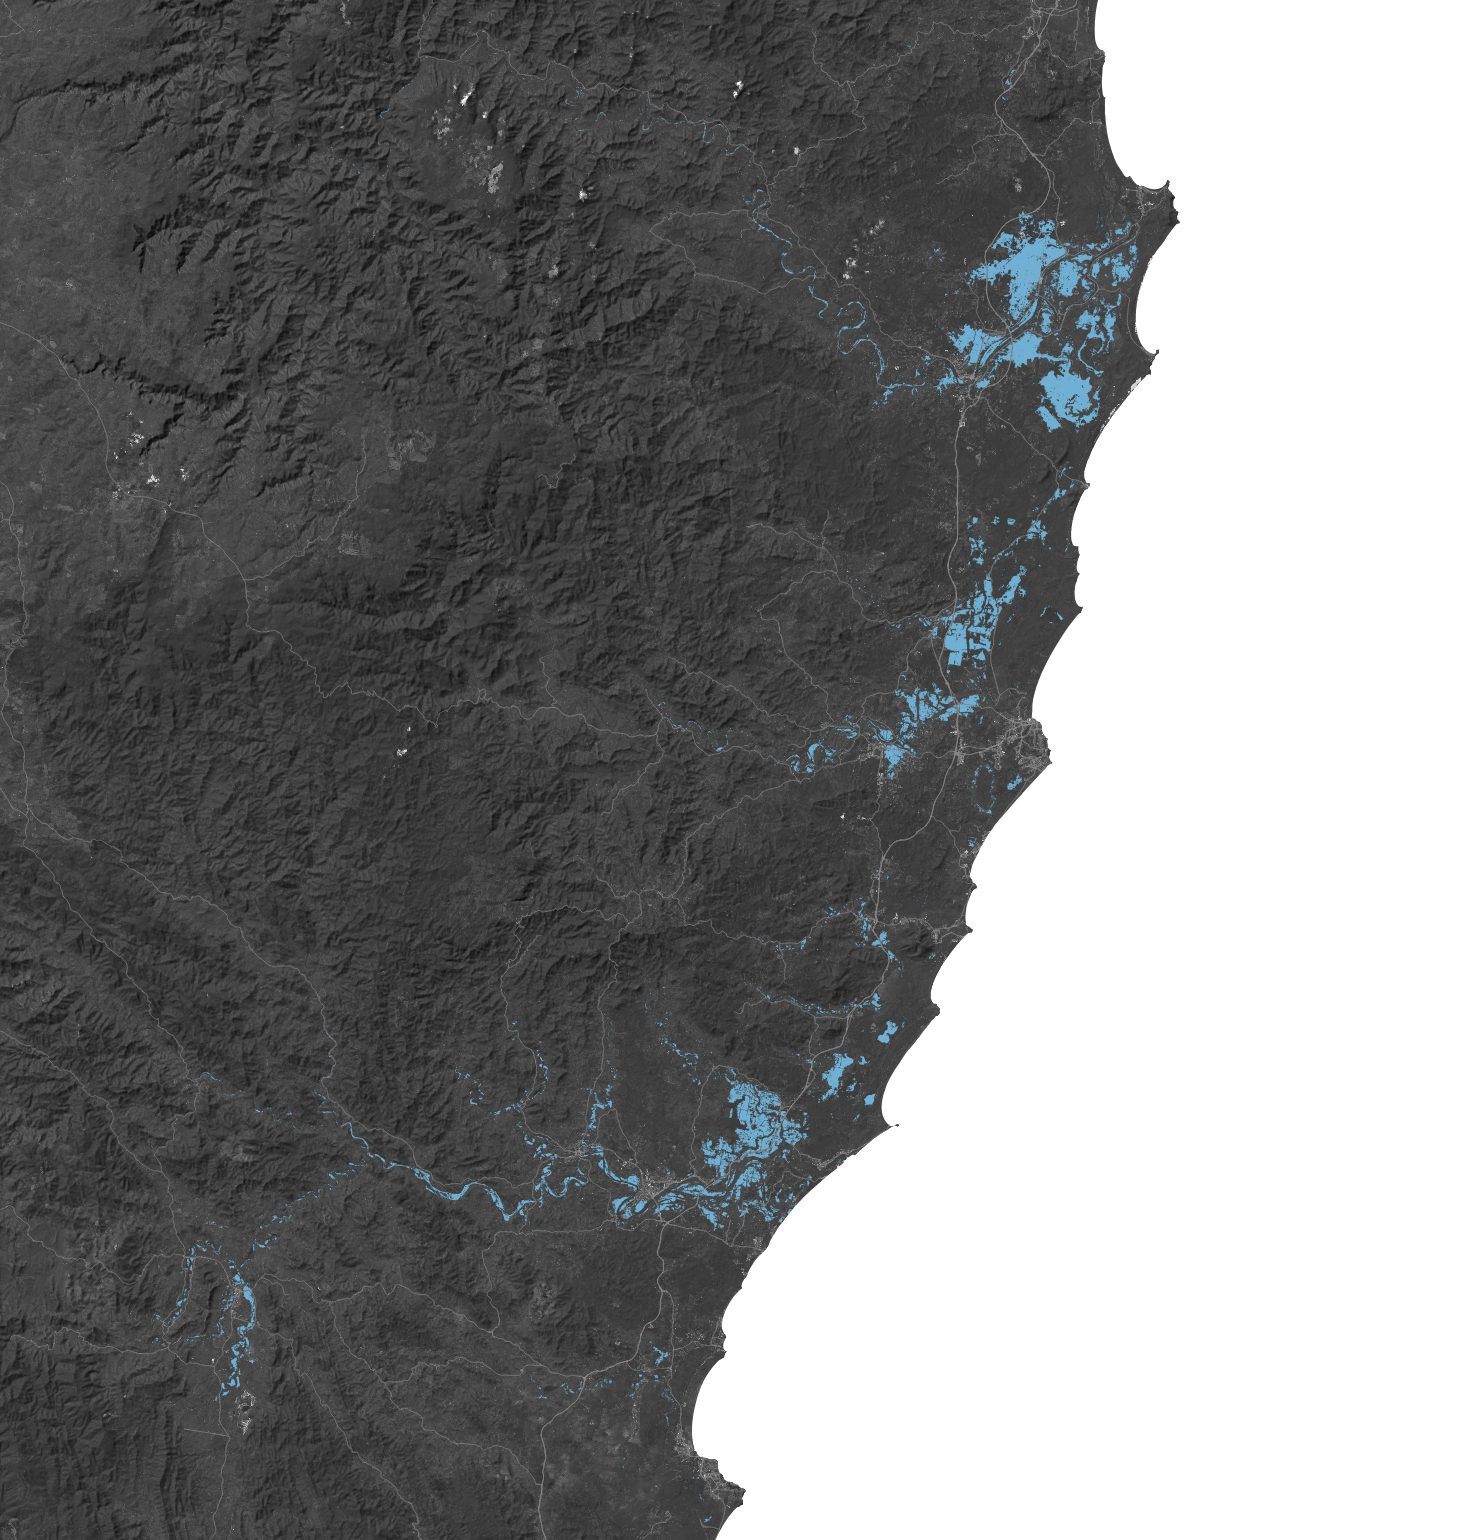
The flood proxy maps above highlight areas of the Mid North Coast region that were likely to be flooded (indicated in blue) on March 20, 2021. The maps were derived from synthetic aperture radar (SAR) data acquired by the Copernicus Sentinel-1 satellites, operated by the European Space Agency (ESA). The maps were created by the National Central University of Taiwan in collaboration with the Advanced Rapid Imaging and Analysis (ARIA) team at the Jet Propulsion Laboratory and Caltech. The ARIA team is supported by NASA’s Earth Science Disasters Program.
Radar signals can penetrate cloud cover, allowing researchers to observe landscapes that are obscured from other satellite sensors. The team created the maps by comparing radar observations collected before and after the rainfall. Specifically, the researchers look for changes in brightness: if a normally rough ground surface is replaced with a smooth water surface, the brightness of those pixels will change.
Many of the areas affected by floods in March 2021 were afflicted with extreme drought and wildfire in the summer of 2020. Burn-scarred landscapes often produce more runoff during extreme rain events because the heat from fires reduces the capacity of the soil to absorb and hold on to water. Furthermore, fire strips away plants and trees that could intercept raindrops before they reach the ground.
The animation above shows rainfall rates and accumulation across eastern Australia from March 16-23, 2021. Those data are overlaid on shades of white and gray from NOAA infrared satellite observations of cloudiness. The rainfall data are remotely-sensed estimates that come from the Integrated Multi-Satellite Retrievals for GPM (IMERG), a product of the Global Precipitation Measurement (GPM) mission. Rainfall rates are marked in blue, while accumulation is represented in green. Due to averaging of the satellite data, local rainfall amounts may be significantly higher when measured from the ground.
Preliminary estimates from NASA’s IMERG analysis indicate that more than 600 millimeters (24 inches) of rain fell just off the coast across the week, with accumulations in coastal areas exceeding 400 millimeters (16 inches). The region usually sees 1000 to 1500 millimeters (40 to 60 inches) of rainfall in a year.
La Niña patterns in the tropical Pacific have brought more rain than usual to eastern and southeastern Australia this summer. That extra rain likely left the soils and waterways with less capacity for absorbing new rainfall in March.
References
- Australian Bureau of Meteorology (2021, March 23) Weekly rainfall update. Accessed March 24, 2021.
- ABC News (Australia) (2021, March 22) Residents of Taree have returned to their homes after flood waters damaged many in the town. Accessed March 24, 2021.
- ABC News (Australia) (2021, March 22) NSW flooding forces 18,000 people to evacuate, schools closed, workers told to stay home. Accessed March 24, 2021.
- ABC News (Australia) (2021, March 20) Warragamba Dam overflows for the first time in years amid NSW extreme weather event. Accessed March 24, 2021.
- BBC (2021, March 22) Australia floods: Western Sydney: ‘Greatest concern’ as more rain falls. Accessed March 24, 2021.
- European Space Agency (2021, March 24) Satellites map record floods in Australia. Accessed March 24, 2021.
- News.com.au (2021, March 23) Australia weather live updates: Evacuation orders for Moree, Southgate as BOM warns flood risk not over. Accessed March 24, 2021.
- NASA Global Precipitation Measurement (2021, March 23) NASA Monitors rain along Australia’s east coast and central desert. Accessed March 24, 2021.
- Reuters Australia (2021, March 23) Australian floods kill two, more evacuations as clean-up begins. Accessed March 24, 2021.
NASA Earth Observatory images by Lauren Dauphin, using modified Copernicus Sentinel data (2021), processed by ESA and analyzed by the National Central University of Taiwan in collaboration with NASA-JPL and Caltech. Landsat data from the U.S. Geological Survey, and topographic data from the Shuttle Radar Topography Mission (SRTM). Animation by Jason West (NASA GSFC) using IMERG data from the Global Precipitation Mission (GPM). Story by Michael Carlowicz.
This image record originally appeared on the Earth Observatory. Click here to view the full, original record.