River Colors are Changing
Downloads
- usrivers_oli_2018_lrg.jpg (4096x2731, JPEG)
- riogrande_oli_2020161.jpg (720x480, JPEG)
- riogrande_tm5_1986163_lrg.jpg (1848x1848, JPEG)
- riogrande_oli_2020161_lrg.jpg (1848x1848, JPEG)
Metadata
- Sensor(s):
- Landsat 5 - TM
- Landsat 7 - ETM+
- Landsat 8 - OLI
- Data Date:
- Visualization Date: February 25, 2021
Much like the sky, rivers are rarely painted one color. Across the world, they appear in shades of yellow, green, blue, and brown. Subtle changes in the environment can alter the color of rivers, though, shifting them away from their typical hues. New research shows the dominant color has changed in about one-third of large rivers in the continental United States over the past 35 years.
“Changes in river color serve as a first pass that tell us something is going on nearby,” said John Gardner, the study’s lead author and a hydrologist at the University of Pittsburgh. “There are a lot of details to parse out on what is causing those changes, though.”
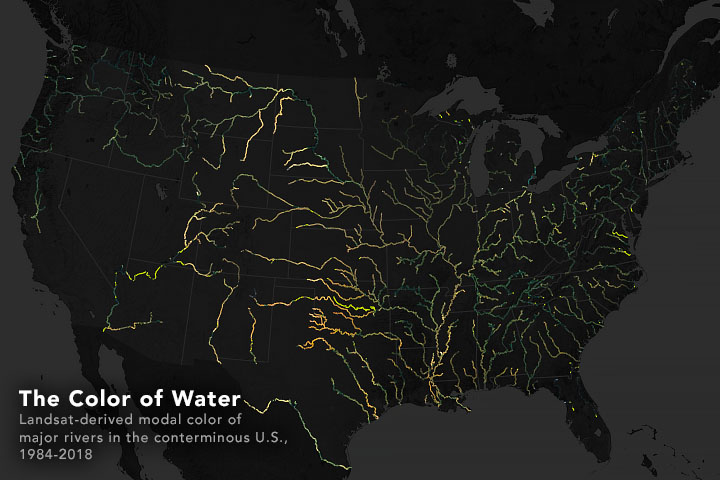
The figure above shows data from the first map of river color for the contiguous United States. The rivers are colored as they would approximately appear to our eye. Gardner and colleagues built the map from 234,727 images collected by Landsat satellites between 1984 and 2018. The dataset includes 67,000 miles (100,000 kilometers) of waterways of at least 200 feet (60 meters) wide. Around 56 percent of rivers were dominantly yellow over the course of the study and 38 percent were dominantly green. The team has released an interactive map where the public can further investigate color trends in individual rivers.
It is not unusual for rivers to change colors, explained Gardner. They change all the time because of fluctuations in flow, concentrations of sediments, and the amount of dissolved organic matter or algae in the water. For example, yellow-tinted rivers are typically sediment-laden but low in algae. Blue water, which is usually easier to see through, has little algae and sediment. Green water usually has algae as its dominant feature.
“We are seeing an increase in the frequency of color changes,” said Gardner. In the study, the team found around 21 percent of rivers became greener, most commonly in the western United States. Around 12 percent of the rivers shifted towards yellow, many in the eastern United States.

The scientists found that the most extreme examples are often found near man-made reservoirs. In fact, the rivers with the fastest rate of color change were twice as likely to be located within 15 miles (25 kilometers) upstream or downstream of a dam and within the boundaries of an urban area.
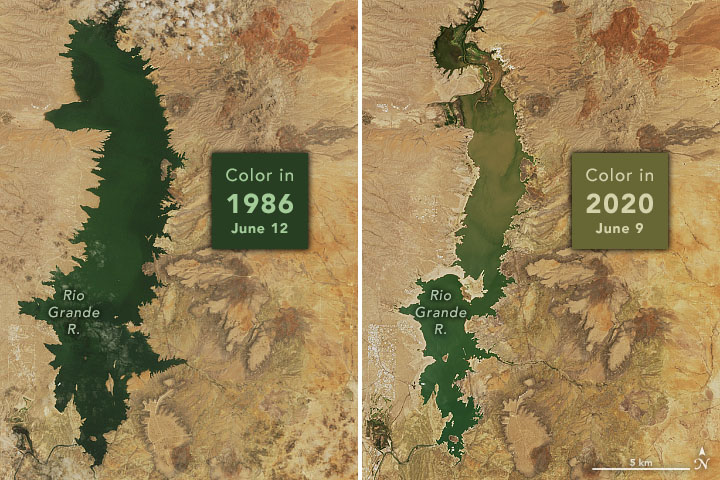
The images above show color changes from 1986 (Landsat 5) to 2020 (Landsat 8) along the Rio Grande River near the Elephant Butte Reservoir in New Mexico. Gardner explained that changes in a reservoir’s surface area can affect river color. When reservoirs contract, the upstream end of reservoirs become sediment-laden rivers again. Gardner is currently working to estimate suspended sediment concentrations based on the Landsat dataset. The goal is to explore how human activities, such as construction of dams or land use, may be affecting sediment loads.
From his own observations, Gardner also noticed more occurrences of algal blooms in rivers. In 2015, an algal bloom stretched across more than 650 miles (1,000 kilometers) of the Ohio River for three weeks, painting portions of the river green. Researchers have typically focused on algal blooms in lakes, but this dataset could help scientists quantify some trends in river chlorophyll concentrations.
“Our findings do not indicate if the color changes are good or bad in terms of water quality, but we showed that we can detect some trends,” said Gardner. “The next step is to investigate what humans are doing to cause those changes and whether it’s an improvement or degradation.”
References and Further Reading
- Gardner, J. R. et al. (2020) The Color of Rivers. Geophysical Researcher Letters, 48 (1).
- The Color of US Rivers.
- The Weather Channel (2020, December 22) One Third of U.S. Rivers Changed Their Color, Three Decades of Satellite Images Show. Accessed February 25, 2021.
- USGS Harmful Algal Blooms. Accessed February 25, 2021.
NASA Earth Observatory images by Joshua Stevens, using data courtesy of Gardner, J., et al. (2020) and Landsat data from the U.S. Geological Survey. Story by Kasha Patel.
This image record originally appeared on the Earth Observatory. Click here to view the full, original record.