Taking Temperatures from ISS
Downloads
- austfires_cti_2019305_lrg.jpg (3044x2029, JPEG)
- austfires_cti_virs_2019305_lrg.jpg (3044x2029, JPEG)
- cti_se2_2019305_lrg.png (2468x1646, PNG)
Metadata
- Sensor(s):
- Suomi NPP - VIIRS
- Landsat 8 - OLI
- ISS - CTI
- Data Date: November 1, 2019
- Visualization Date: April 6, 2020
When remote sensing scientists observe Earth, they often look for heat signatures. Fires, volcanoes, ice, water, and even sunlit or shaded landscapes emit and reflect heat and light—energy—in ways that make them stand out from their surroundings. NASA scientists recently used a new sensor to read some of those signatures more clearly.
Through nearly a year of testing on the International Space Station (ISS), the experimental Compact Thermal Imager (CTI) collected more than 15 million images of Earth, and the results were compelling. Researchers were impressed by the breadth and quality of the imagery CTI collected in 10 months on the ISS, particularly of fires.
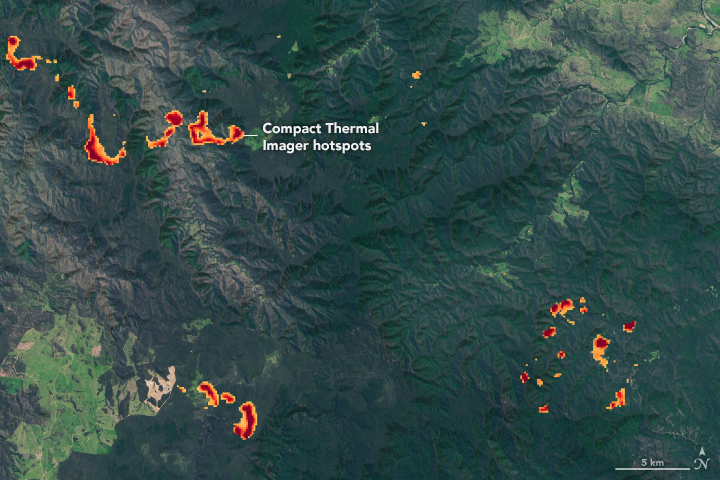
For instance, CTI captured several images of the unusually severe fires in Australia that burned for four months in 2019-20. With its 80-meter (260 foot) per pixel resolution, CTI was able to detect the shape and location of fire fronts and how far they were from settled areas—information that is critically important to first responders.
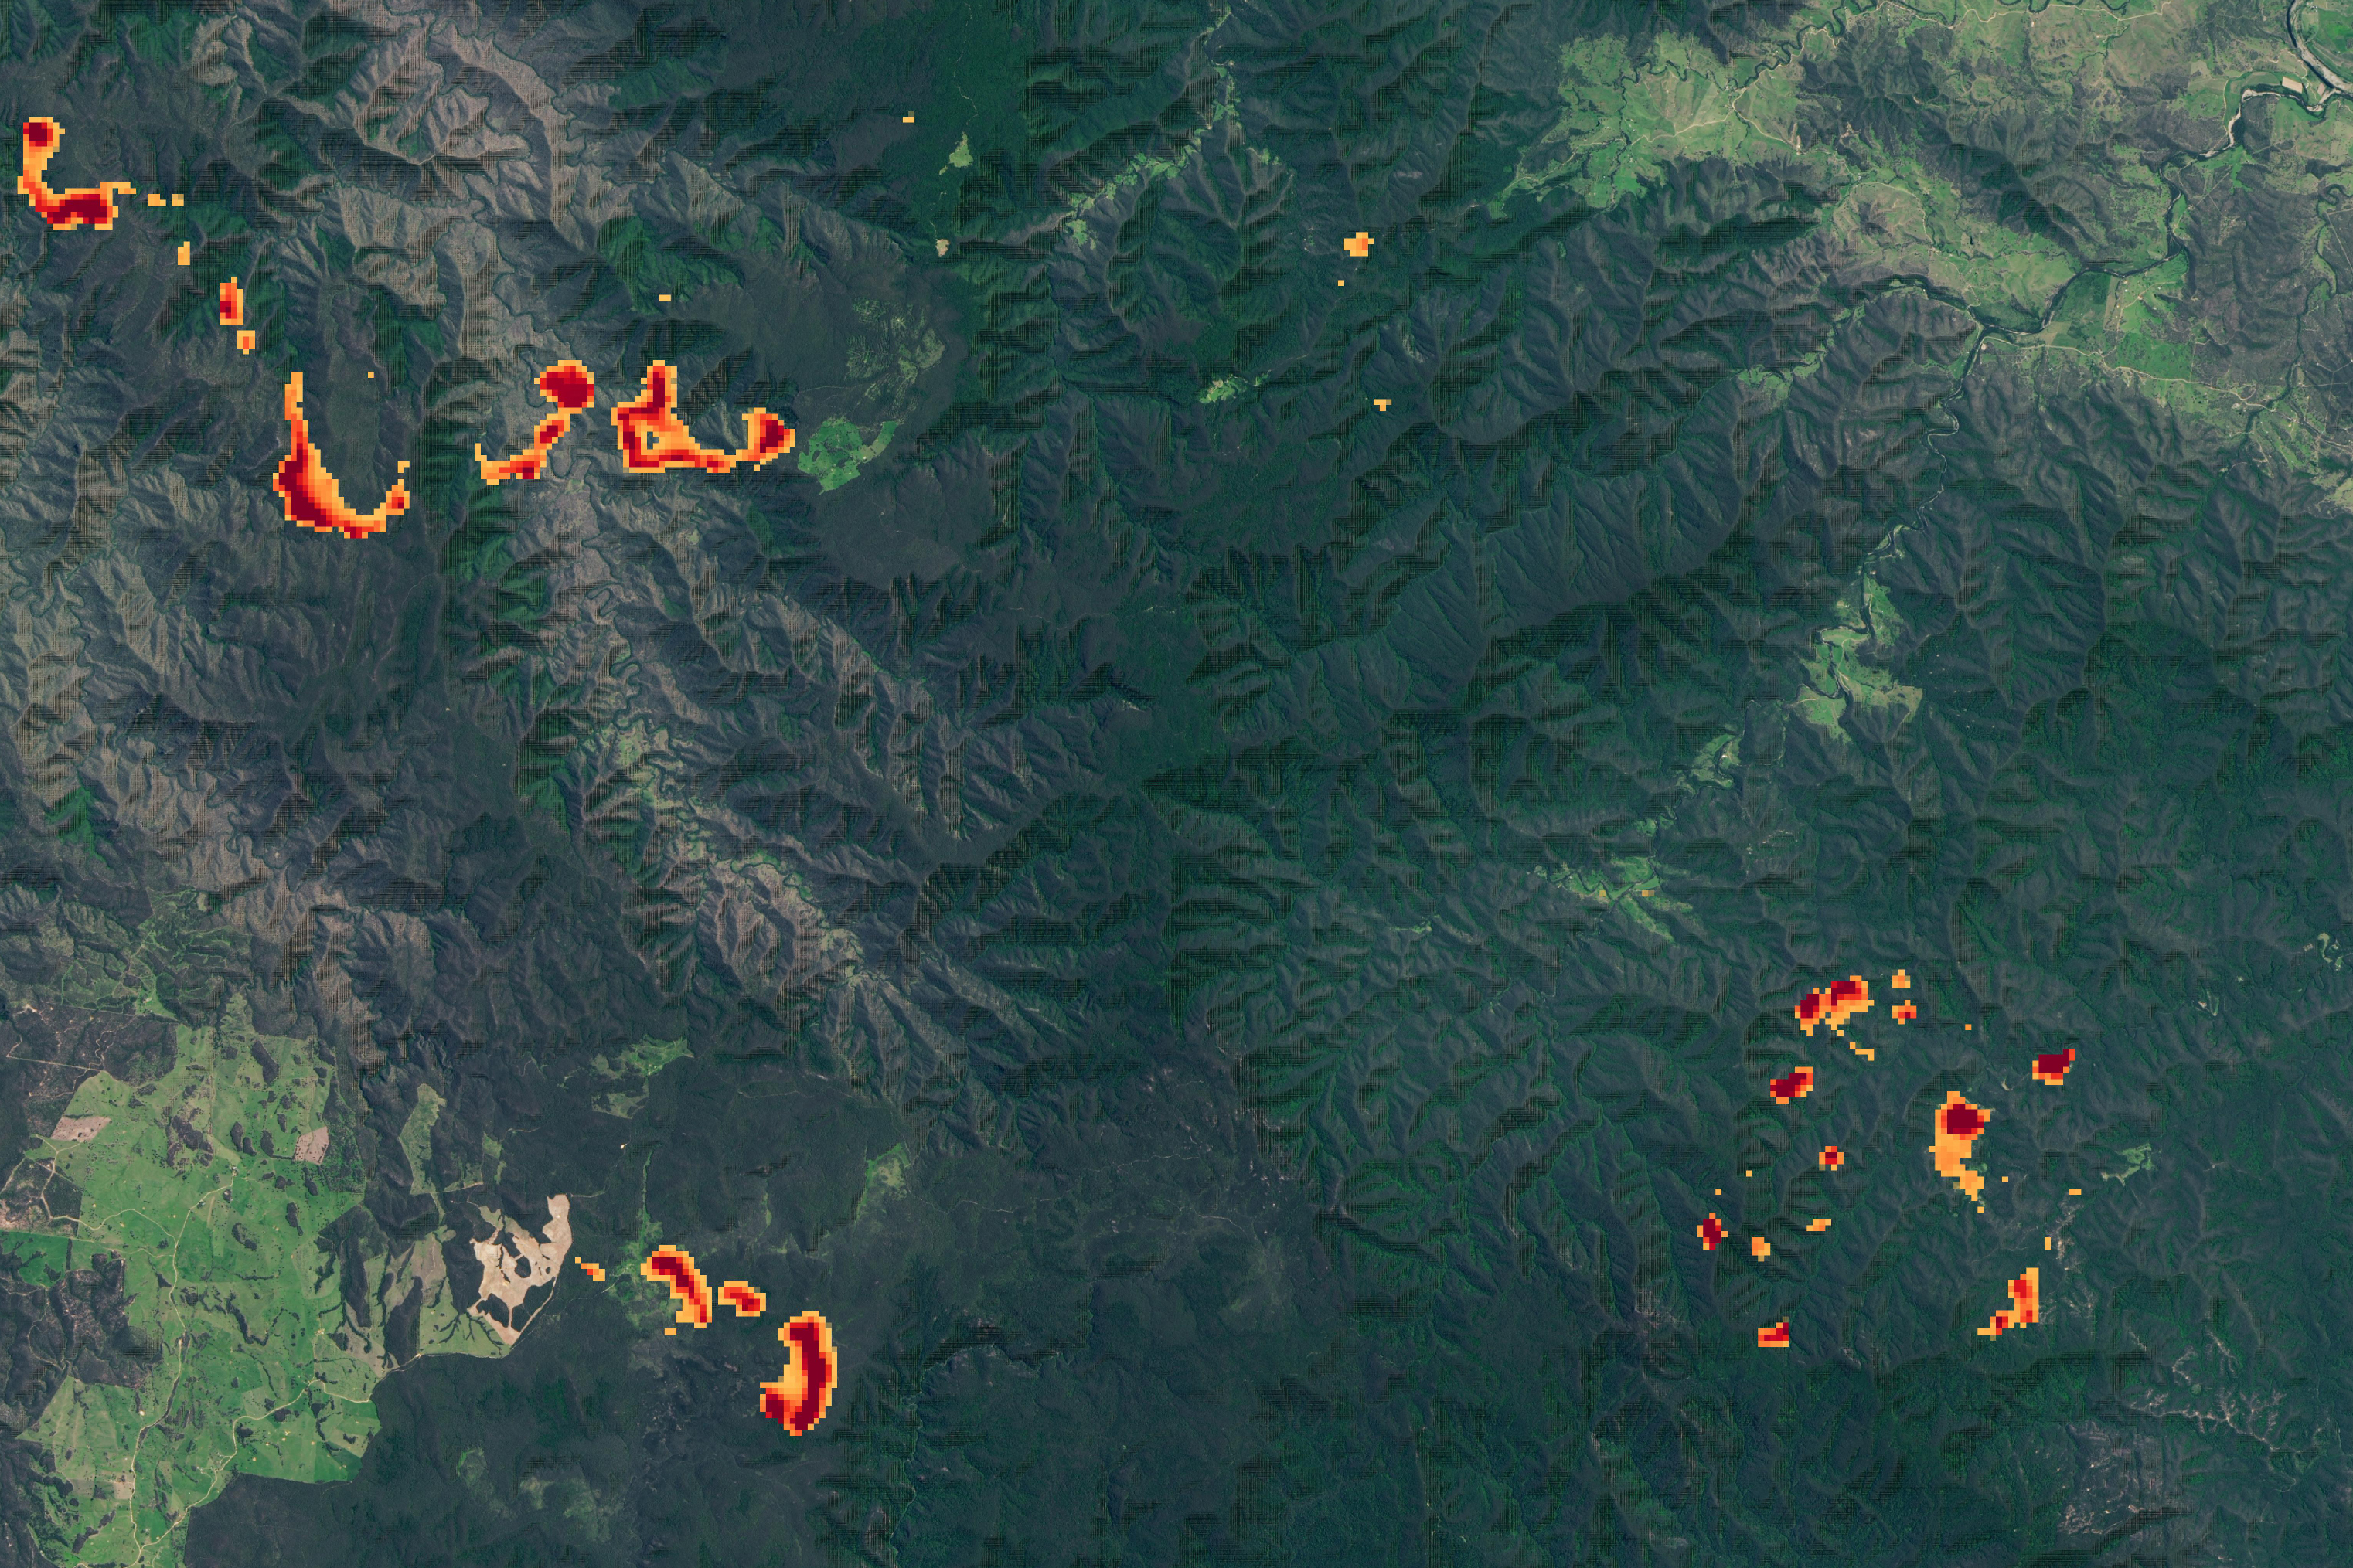
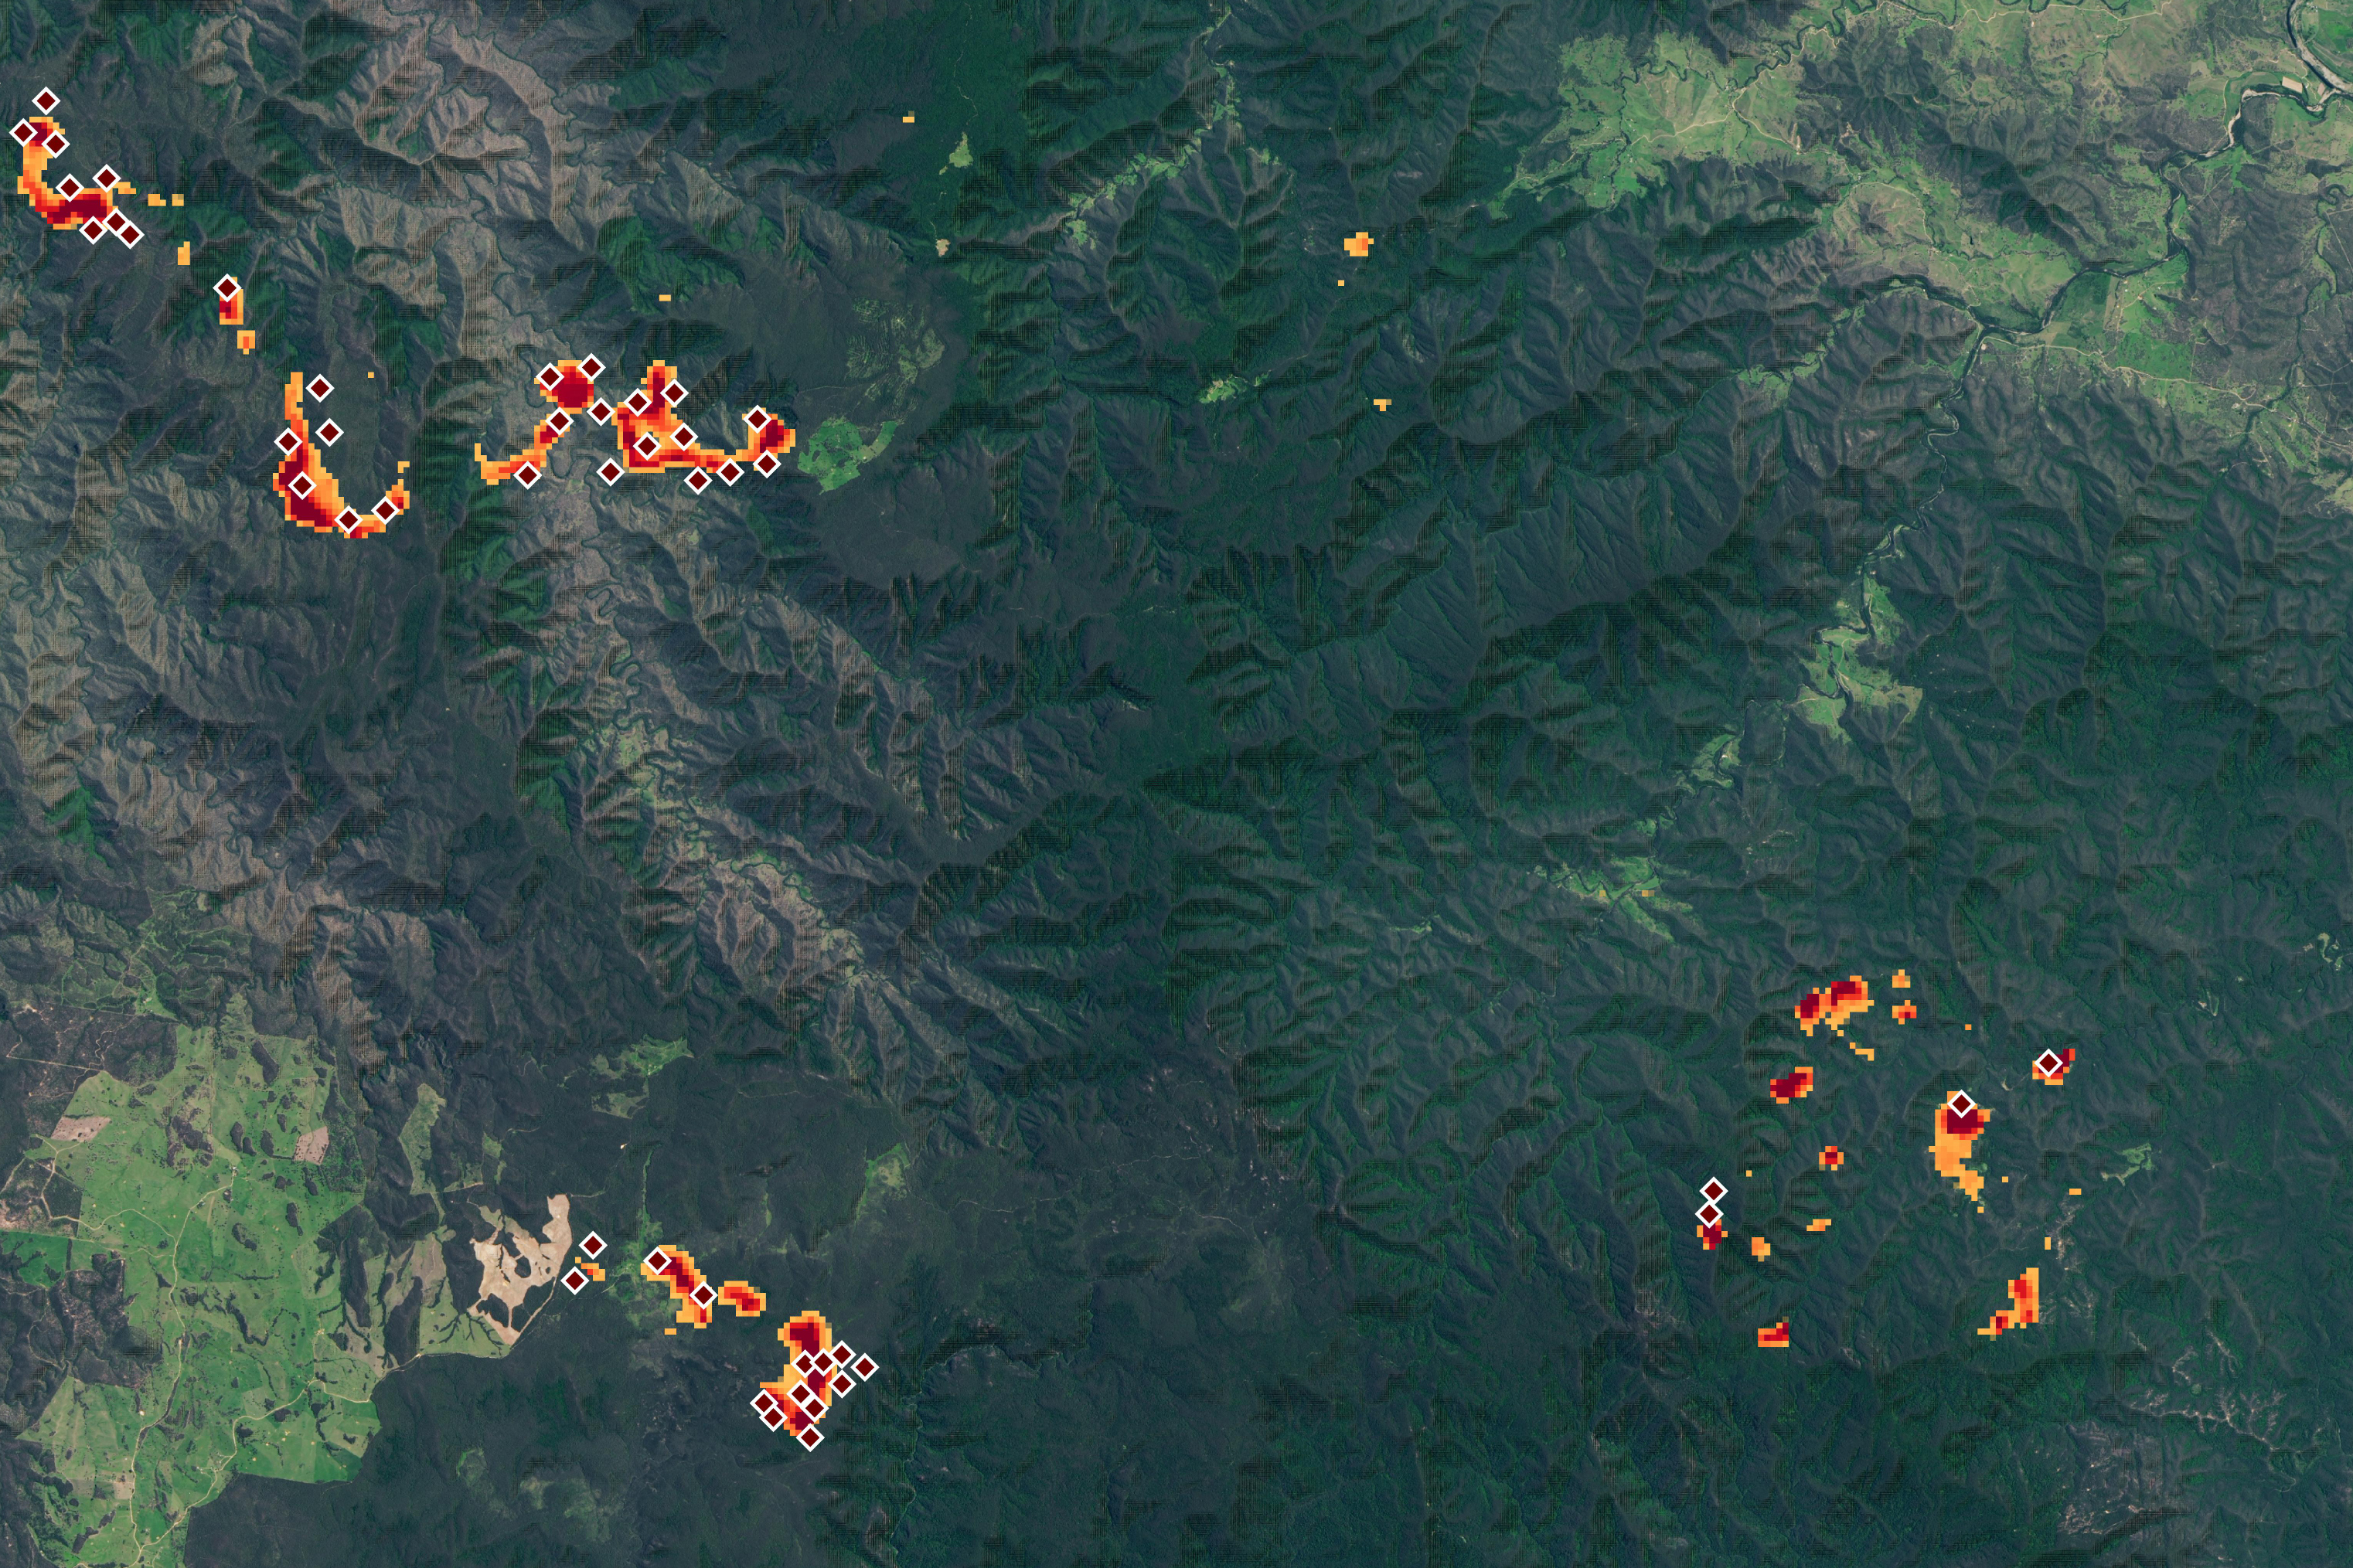
For the past two decades, scientists have generally relied upon coarse resolution (375–1000 m) thermal data from the satellite-based Moderate Resolution Imaging Spectroradiometer (MODIS) and Visible Infrared Imaging Radiometer Suite (VIIRS) sensors to monitor fire activity from above. During its flight test, CTI made observations of fires with 20 times more detail than VIIRS and 190 times more detail than MODIS.
The images above highlight the difference. Both images show CTI’s view of large fires burning in the Gondwana Rainforests of New South Wales on November 1, 2019. The right image also includes the VIIRS fire detections (red diamonds) of the same area that day. The data were overlaid on a natural-color image acquired by the Operational Land Imager (OLI) on Landsat 8.
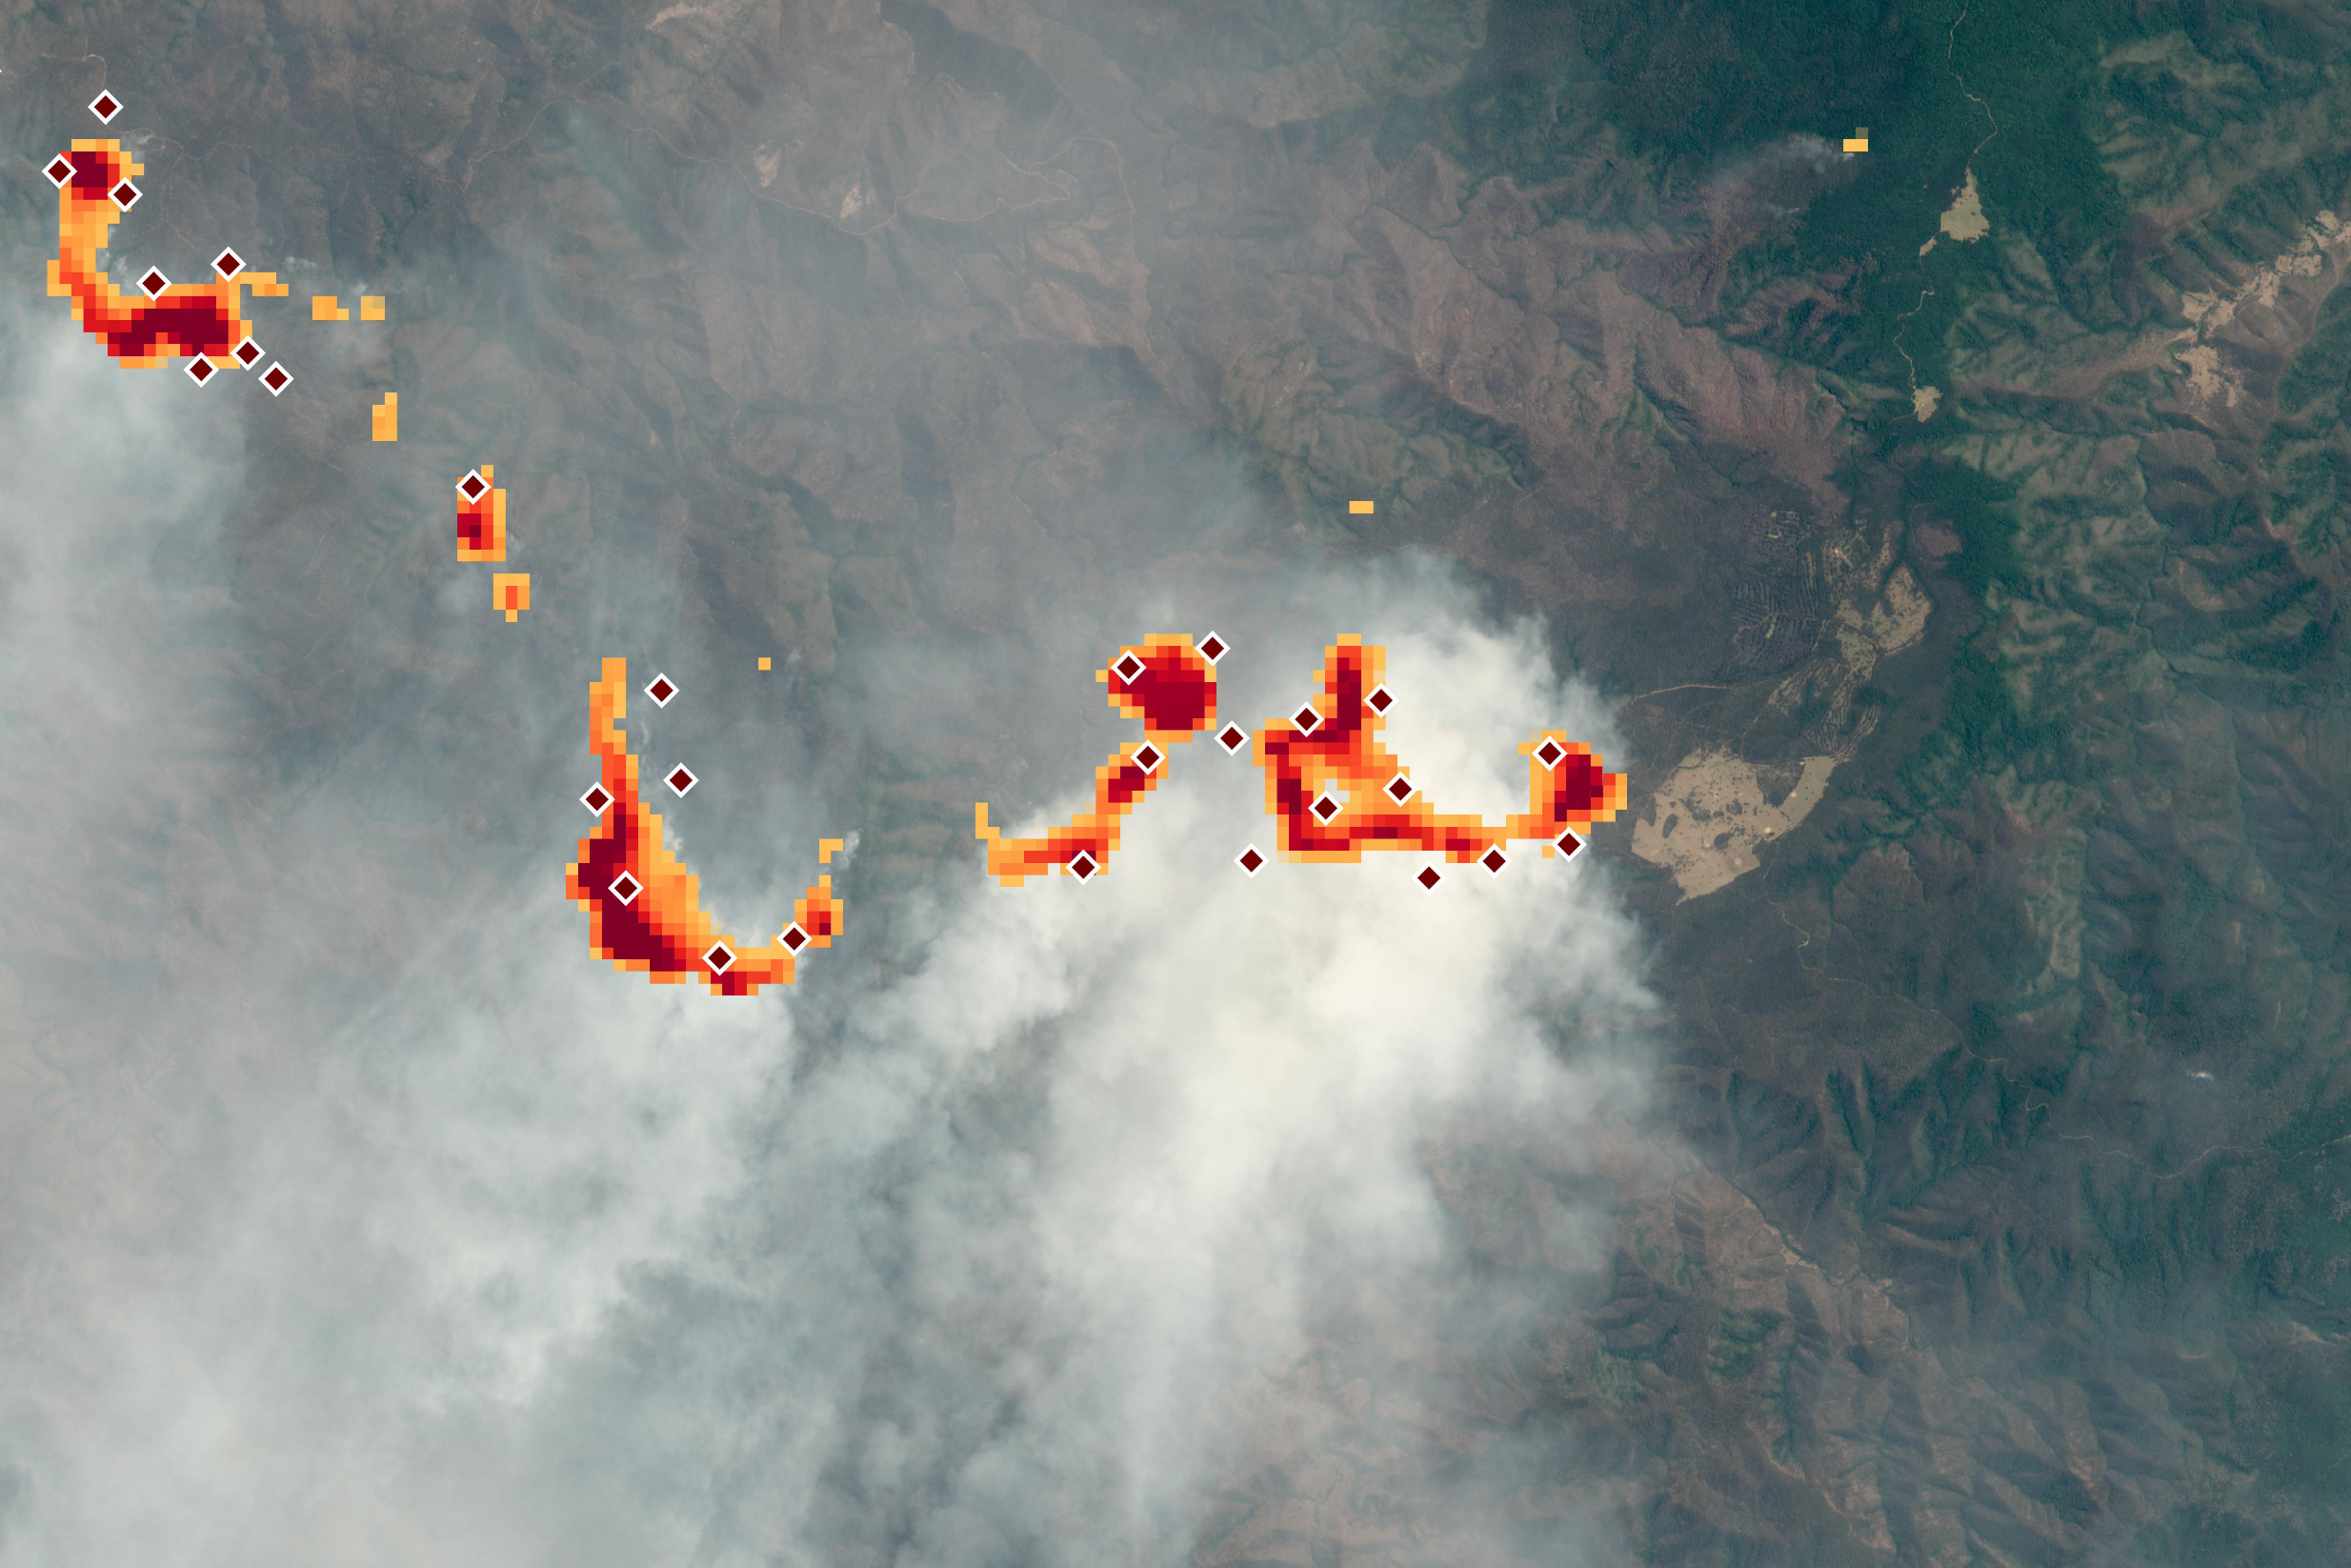
The image below, acquired by the European Space Agency’s Sentinel-2 spacecraft on November 1, shows a more detailed view of one of the fire clusters, along with the CTI data.
“CTI’s deployment on the space station was primarily a test of how well the hardware would perform in space. It was not initially designed as a science mission,” explained Doug Morton, chief of the Biospheric Sciences Laboratory at NASA’s Goddard Space Flight Center. “Nonetheless, CTI data proved scientifically useful as we monitored several high-profile fire outbreaks this past summer.”
One aspect of CTI’s mission that was of particular interest to Morton was the timing of the images. MODIS and VIIRS have polar orbits and make observations over a given area at the same time each day (roughly 10:30 a.m. and 1:30 p.m.). Imagers on the ISS provide more variety and less consistency in timing, as the orbit of the International Space Station is more variable, as is the lighting and angles as it passes over different locations.
“We ended up getting these amazing images of fires at times of the day when we don’t usually get them,” said Morton. Fire researchers are eager to have more views of fires around dawn and dusk, which are sometimes missed by MODIS and VIIRS. “It was a reminder of how much critical science we could do if we had a whole fleet of sensors like CTI giving us such detailed measurements multiple times a day.”
CTI was designed at NASA’s Goddard Space Flight Center and installed on the ISS in 2019 as part of the Robotic Refueling Mission 3. It used an advanced detector called a strained layer superlattice (SLS), an improved version of the detector technology that is part of the Thermal Infrared Sensor (TIRS) of Landsat 8 and 9.
“The new SLS technology operates at a much warmer temperature with greater sensitivity and has a broader spectral response than the TIRS technology, resulting in a smaller and less costly instrument to design and build,” said Murzy Jhabvala, principal investigator for CTI. “SLS has proved itself. This technology is now a viable candidate for the future Landsat 10 and a variety of other lunar, planetary, and asteroid missions.”
References
- EOS (2019, April 30) New Eyes on Wildfires. Accessed April 6, 2020.
- Jhabvala, M. et al. (2019) Strained-layer-superlattice-based compact thermal imager for the International Space Station. Applied Optics, 58 (20), 5432-5422.
- Jhabvala, M. (2020) QWIPs, SLS, Landsat and the International Space Station. Quantum Sensing and Nano Electronics and Photonics, 1128802.
- NASA Robotic Refueling Mission RRM 3. Accessed April 6, 2020.
- NASA (2018, July 31) NASA Next-Generation Photodetector Camera to Deploy During Robotic Servicing Demonstration Mission. Accessed April 6, 2020.
NASA Earth Observatory images by Lauren Dauphin, using Landsat data from the U.S. Geological Survey, VIIRS data from NASA EOSDIS/LANCE and GIBS/Worldview and the Suomi National Polar-orbiting Partnership, topographic data from the Shuttle Radar Topography Mission (SRTM), and modified Copernicus Sentinel data (2018) processed by the European Space Agency. CTI data courtesy of the CTI team at NASA’s Goddard Space Flight Center. The sensor was developed with QmagiQ and funded by the Earth Science Technology Office (ESTO). Story by Adam Voiland.
This image record originally appeared on the Earth Observatory. Click here to view the full, original record.