A New Measuring Stick for Forests
Downloads
- pnw_gedi_chart_web_alt.png (720x500, PNG)
- pnwbeam_oli_2019210.png (720x545, PNG)
- amazon_gedi_chart_alt.png (720x420, PNG)
- amazonbeam_oli_2019221.png (720x545, PNG)
Metadata
- Sensor(s):
- Landsat 8 - OLI
- Data Date:
- Visualization Date: January 24, 2020

“The amount of carbon that is being held in the land surface by trees, and how it has changed over time through disturbance and subsequent regrowth, is the least understood aspect of the global carbon cycle,” said Ralph Dubayah, a remote sensing scientist at the University of Maryland. “Until we know how much carbon there currently is in Earth’s forests, and how that has changed over the last 20 to 30 years, we will have a difficult time predicting how much more carbon forests will absorb in the future, and what role they’ll play in helping to mitigate or accelerate atmospheric carbon dioxide concentrations.”
Dubayah and colleagues are working hard to measure that carbon, and they have a great new tool to do so. The Global Ecosystem Dynamics Investigation (GEDI) mission has been flying for nearly a year on the International Space Station, and researchers have just released to the public the first GEDI measurements of forests around the world.
GEDI surveys Earth’s forests through light detection and ranging (lidar). The instrument sends out rapid pulses from three lasers and records how the light bounces off of surfaces and objects to detect their location and shape—similar to the way radar detects shapes by observing reflections of radio waves. From these lidar signals, the GEDI team can construct detailed, three-dimensional maps of forest canopy height and the distribution of branches and leaves.
“Existing pan-tropical biomass maps use laser data acquired nearly 15 years ago and were based on less than 5 million laser observations in total,” said Dubayah, the GEDI principal investigator. “GEDI collects six million laser observations every day. So over the tropics, we’ve already collected about two orders of magnitude more data than what was ‘state-of-the-art’ before.”
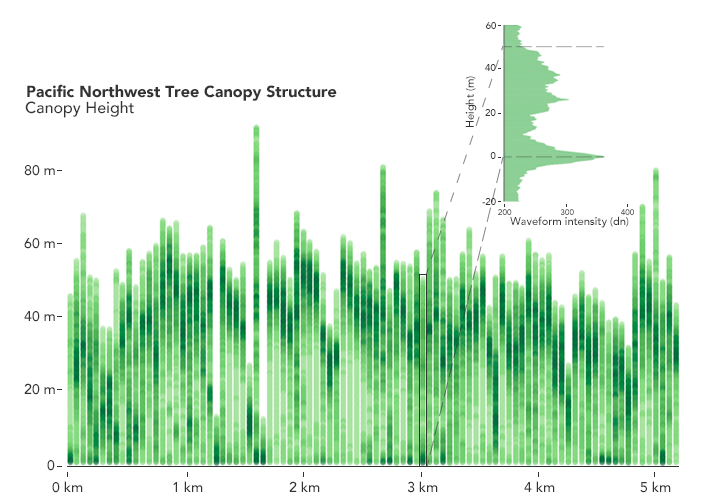
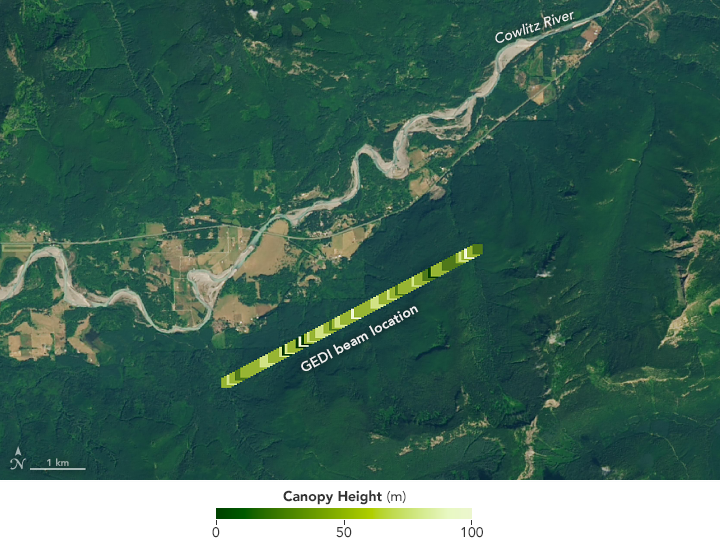
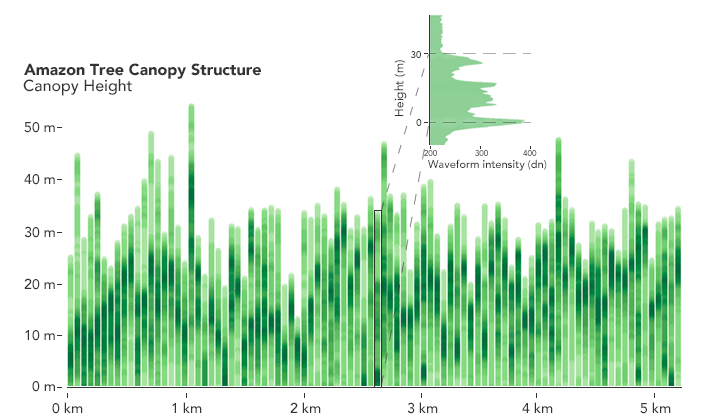
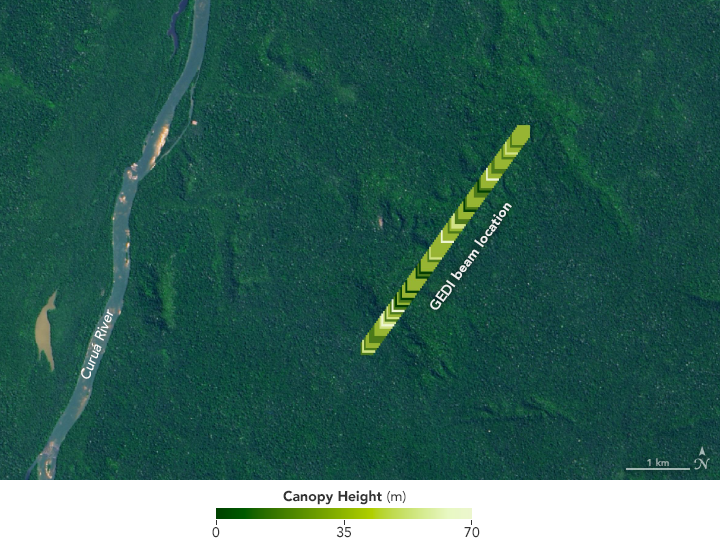
The images on this page provide examples of what GEDI observed in the Pacific Northwest of the United States (above) and in the Amazon rainforest in Brazil (below). Green vertical bars depict the canopy height and density, with darker greens marking areas with thicker, denser vegetation. The inset box above the plot shows the waveform patterns measured by the instrument that reveal the structure below. The natural-color images show how uniform the forest looks to a downward (nadir) looking satellite, compared to the detailed structure revealed by GEDI.


“Measurements over vegetation are challenging,” said Bryan Blair, GEDI’s deputy principal investigator and an instrument scientist from NASA’s Goddard Space Flight Center. “To make these accurate height measurements, we use a technique called waveform lidar that maps the 3-D structure of the forests. To do this accurately, we need to penetrate the canopy and see a sometimes very weak ground signal. We have been using this measurement from aircraft for more than 25 years, but when you implement that in space, you have to be very efficient with resources like mass and power and you can’t make the sensor too complex or expensive.”
GEDI views a forest as a collection of waveforms that show the treetops, the ground, and the branches, leaves, and open space in between. Put together, the collections of waveforms begin to show the forest’s structure—not only vertically, but horizontally. This allows scientists to calculate the amount of biomass and carbon contained in a given area of forest.
With a global map of the mass contained in forest tree trunks, branches, and leaves, researchers can estimate how much carbon different forest areas contain and how that changes over time. Researchers will also be able to model biodiversity around the world.
NASA Earth Observatory images by Lauren Dauphin, using using GEDI data courtesy of the University of Maryland and Landsat data from the U.S. Geological Survey. Story by Jessica Merzdorf, NASA Goddard Space Flight Center, with Mike Carlowicz. Earth Observatory.
This image record originally appeared on the Earth Observatory. Click here to view the full, original record.