Spotting the Spotted Owl: 30 Years of Forest Disturbance
Downloads
- spottedowl2_pho_2019_lrg.jpg (4608x3456, JPEG)
- owls_agent_2016_eastern_wa.jpg (720x609, JPEG)
- owls_nso_2016_eastern_wa.gif (720x609, GIF)
Metadata
- Sensor(s):
- Landsat 5 - TM
- Landsat 7 - ETM+
- Landsat 8 - OLI
- Data Date:
- Visualization Date: December 18, 2019
Today’s Image of the Day builds on this story from December 18, 2019.
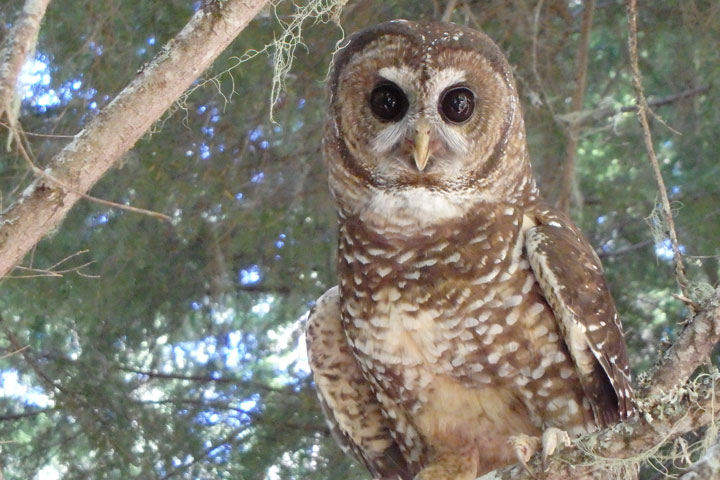
Sometimes it seems as if the northern spotted owl can’t catch a break. After decades of policy changes slowed the loss of its habitat, populations of this “threatened” species are still declining. But armed with decades of satellite and ground-based data, researchers have not given up on the bird.
The number of northern spotted owls is declining an average of 4 percent each year across its geographical range—including nearly 25 million acres of federal forests in Washington, Oregon, and Northern California. Once the main threat to their survival was timber harvesting on federal lands. Now pressure from the barred owl, which has swooped in to compete for habitat and food, is thought to be the main culprit. Nonetheless, forest disturbances like timber harvesting and fire continue to play a role in the spotted owls’ troubles.


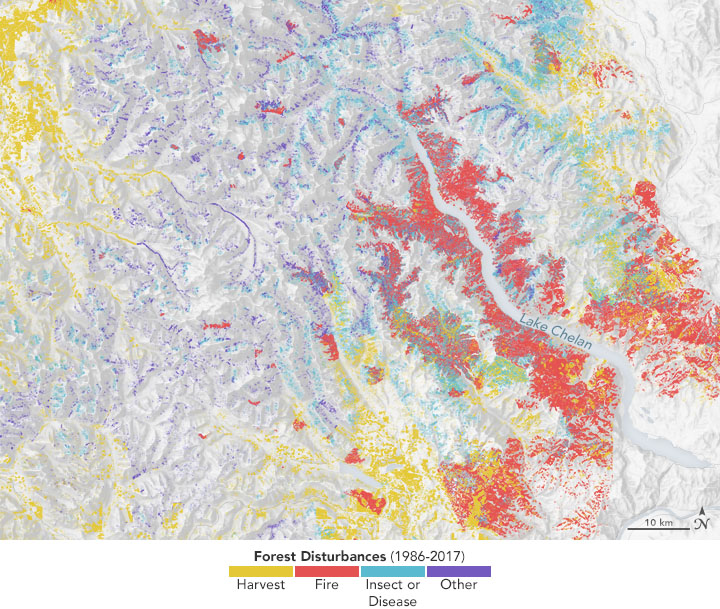
The first map above shows forest disturbances detected each year between 1986 and 2017 across some of the owl’s range in eastern Washington. Disturbances from timber harvesting are shown in gold; fires and their scars are red; and tree mortality from insects and disease are blue. Purple areas represent everything else that can affect forest cover, from storms to drought.
The animation shows how such disturbances have affected the forests that spotted owls consider suitable for nesting or resting (roosting). Both maps are based in on models that combine Landsat data—which can decipher vegetation, water, and bare and burned land—with measurements of climate, topography, and other data from the U.S. Forest Service’s annual ground surveys or the Forest Inventory and Analysis Program. By relating the satellite views of forest cover to ground-based observations of where spotted owl pairs nest and roost, scientists were able to map their habitat.
The history of rigorous monitoring stems from the Northwest Forest Plan: science-based guidelines to balance land use with the protection of habitat of species dependent upon older forests. Since the plan was implemented in 1994, there has been less habitat loss on federal lands from timber harvesting. Wildfires, however, continue to make a significant mark on the landscape.
“I think that there is an interesting dichotomy in the role of fire in nesting and roosting habitat,” said David Bell, a researcher with the USFS Pacific Northwest Research Station. He explained that recent fires have led to major losses in nesting-roosting forest cover. In contrast, areas where fires fired burned in the late 19th and early 20th centuries and now show long-term habitat recovery.
Notice in the animation how nesting/roosting forest cover disappears in the lower elevations near Lake Chelan. As the disturbance map indicates, habitat loss in eastern Washington is primarily the result of fire, and the landscape has not recovered much. In other parts of the owl’s range—particularly in Oregon and northern California—habitat is showing some recovery after much older fires.
While fires and timber harvesting are the main environmental factors affecting habitat, more subtle disturbances could be important, too. Sean Healey, an ecologist with the USFS Rocky Mountain Research Station, is working to make greater use of remote sensing in the mapping of forest change. He worked on the first region-wide disturbance map, completed in 2003, at a time when the team could only afford to use one Landsat image every four years because the data were only available for a fee.
“The opening of the Landsat archive in 2008 was pivotal,” Healey said. That was the year that the U.S. Geological Survey made all Landsat data available for free. Open access to every image gave scientists the opportunity to look at each area many times within a year. By repeatedly looking at the same place, they could begin to separate forest disturbances from other irrelevant patterns—effects that might be due to the atmosphere or simply seasonal changes in leaf colors.
Looking at change annually instead of every four years also allowed scientists to detect some of the more nuanced changes. For instance, drought, insects, and pre-commercial tree thinning are much more common than scientists previously thought. In fact, it’s rare to find a large expanse of forest that has not been disturbed.
“We now have the best available map of disturbances for the United States,” Healy said of the Pacific Northwest forest holdings. “The next task is to find out how and why some places are recovering faster than others.”
References and Related Reading
- NASA Earth Observatory (2019, December 18) Spotting the Spotted Owl: 30 Years of Habitat Change.
- NASA Earth Observatory (1999, June 15) Spotting the Spotted Owl.
- Northwest Forest Plan—Regional Ecosystem Office Northern Spotted Owl Monitoring Program. Accessed December 17, 2019.
- USDA Forest Service, Northwest Forest Plan. Accessed December 17, 2019.
- USFS Pacific Northwest Research Station and Oregon State University, Landscape Ecology, Modeling, Mapping & Analysis. Accessed December 17, 2019.
NASA Earth Observatory images by Joshua Stevens, using Landsat data from the U.S. Geological Survey, topographic data from the Shuttle Radar Topography Mission (SRTM), and photo and owl habitat data courtesy of Raymond Davis/USDA/USFS. Story by Kathryn Hansen.
This image record originally appeared on the Earth Observatory. Click here to view the full, original record.