
Spotting the Spotted Owl: 30 Years of Habitat Change
Downloads
- spotted_owl_study_area.jpg (720x355, JPEG)
- owls_nso_2016_western_wa.gif (720x545, GIF)
- owls_agent_2016_western_wa.jpg (720x553, JPEG)
Metadata
- Sensor(s):
- Landsat 5 - TM
- Landsat 7 - ETM+
- Landsat 8 - OLI
- Data Date:
- Visualization Date: December 11, 2019
Editor’s note: This article is the first of two parts.
In the forests of the Pacific Northwest, you can still occasionally hear the hoot of the northern spotted owl or see its camouflaged plumage. But after three decades of conservation efforts, the survival of this species continues to be challenged. Satellites have been helping researchers understand why.
On the surface the reason seems simple: there has been robust competition for limited resources. Economic demand for wood and paper products led companies to harvest timber from old-growth forests—important spotted owl habitat. Within the habitat that remained, the barred owl moved in. This invasive, competing owl species has further depleted the spotted owl’s food supply and nesting space.
Even before barred owls were recognized as a serious threat, habitat loss appeared grim enough in 1990 for the spotted owl to be listed as “threatened” under the U.S. Endangered Species Act. Today, the owls are still threatened and populations are still declining.
Over those three decades, satellite- and ground-based data have been collected and incorporated into new computer models and studies. And across the spotted owl’s geographical range within 25 million acres of federal forests, a nuanced picture of habitat has emerged.
“We are now able to produce animations of how habitat and forest disturbances have unfolded over the last three decades,” said Raymond Davis of the U.S. Forest Service. “From a habitat monitoring standpoint, these visualizations allow us to better understand where and how habitat is changing and what is causing those changes. It’s also a good way to communicate these habitat dynamics, as opposed to trend lines and bar graphs.”
The animation above shows forest cover types on the Olympic Peninsula in Washington state that spotted owls consider suitable for nesting or for simply resting (roosting) in the trees. (You won’t see a spotted owl build a nest; instead, they nest in existing structures and tree cavities, broken tree tops, or in nests built by other species.)
Green is the “core cover type,” where the composition and structure of the forest is sufficient and the area large enough for spotted owls to nest and roost. Orange is “fragmented cover type,” where forested areas are still suitable for nesting and roosting, but lack larger patches and contain more forest edge. Stacked together, the single-year maps from 1986 and 2017 add up into a long view of how the owl’s habitat changed.
Notice the decline of core cover type in the Olympic National Forest, particularly northwest of Lake Quinault through the mid-1990s. In later years, the core cover type appears relatively stable, with some areas blinking out and others filling in. This is likely a result of the Northwest Forest Plan, implemented in 1994, which established science-based guidelines to balance land use with the protection of the habitat of species that rely on older forests.
By comparison, notice that core cover type within Olympic National Park is relatively stable. The exception is the patch of land along the Queets River where the Paradise fire burned in summer 2015. At the time, the rare rainforest fire was the largest in the history of the park, having burned nearly 3,000 acres (12 square kilometers) of forest, including old-growth habitat.
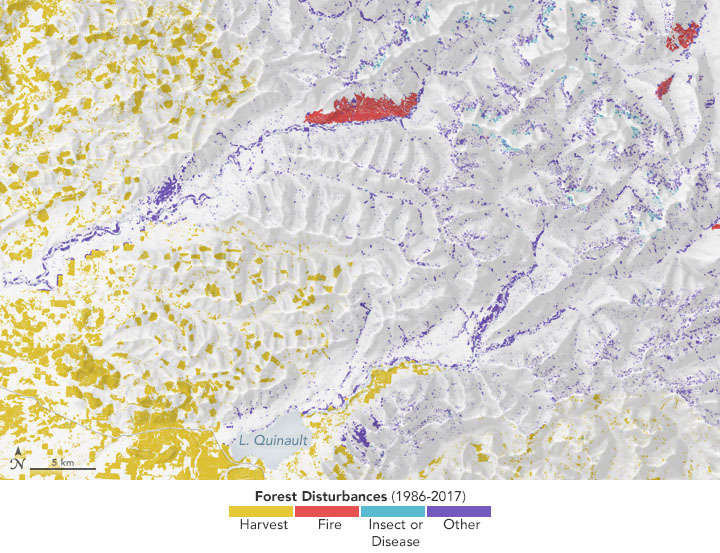
Compare the patterns of nesting/roosting cover with those in the second map, which shows the cumulative effect of forest disturbances in the same area. Gold is where timber has been harvested, and red is where fires have burned through the trees.
Both maps are based in part on models that combine Landsat data—which can tell you which areas are vegetation, water, and bare land, as well as burned land—with measurements of climate, topography, and other data from the U.S. Forest Service’s (USFS) annual ground surveys. By relating the forest cover (viewed from above) to ground-based observations of where territorial spotted owl pairs reside, scientists were able to map their habitat.
“We have generated maps for all forests in California, Oregon, and Washington for each year from 1986-2017 and efforts are underway to perform similar mapping across the conterminous United States,” said David Bell, a researcher with the USFS Pacific Northwest Research Station’s Vegetation Monitoring and Remote Sensing team. “The all-lands and all-years perspective allows us to examine forest change at several spatial and temporal scales: from watersheds to regions and from years to decades.”
But even when habitat has rebounded in some areas, it does not necessarily mean that species numbers will recover. “The spotted owl population is still going down, and the main culprit is now the barred owl,” said Davis. “We need to continue to use remote sensing to track the status and trends of spotted owl habitat, but we also need to factor in other variables like barred owl presence.”
Read more about spotted owls and long-term observations of forest disturbance in this related story.
References and Related Reading
- NASA Earth Observatory (1999, June 15) Spotting the Spotted Owl.
- Northwest Forest Plan—Regional Ecosystem Office Northern Spotted Owl Monitoring Program. Accessed December 17, 2019.
- USDA Forest Service, Northwest Forest Plan. Accessed December 17, 2019.
- USFS Pacific Northwest Research Station and Oregon State University, Landscape Ecology, Modeling, Mapping & Analysis. Accessed December 17, 2019.
NASA Earth Observatory images by Joshua Stevens, using Landsat data from the U.S. Geological Survey, topographic data from the Shuttle Radar Topography Mission (SRTM), and owl habitat data courtesy of Raymond Davis/USDA/USFS. Story by Kathryn Hansen.
This image record originally appeared on the Earth Observatory. Click here to view the full, original record.