Darkness in the Wake of Idai
Downloads
- beira_blm_2019083.png (720x480, PNG)
- beira_blm_2019068_lrg.png (720x480, PNG)
- beira_blm_2019083_lrg.png (720x480, PNG)
- idai_mrg_2019079_lrg.png (3280x2420, PNG)
Metadata
- Sensor(s):
- Suomi NPP - VIIRS
- Landsat 8 - OLI
- Data Date: March 9, 2019 - March 24, 2019
- Visualization Date: March 26, 2019
In March 2019, Tropical Cyclone Idai pummeled through southeastern Africa to become one of the deadliest storms ever recorded to hit the Southern Hemisphere. The storm caused catastrophic flooding, landslides, and large numbers of casualties across Mozambique, Malawi, and Zimbabwe. One of the most affected areas was Beira, Mozambique’s second-largest port city of 530,000 people, where the cyclone made landfall on March 14.
The storm “destroyed 90 percent” of Beira, according to an initial assessment by a team from the International Federation of Red Cross and Red Crescent Societies. As of March 20, an estimated 1 million people were without electricity.
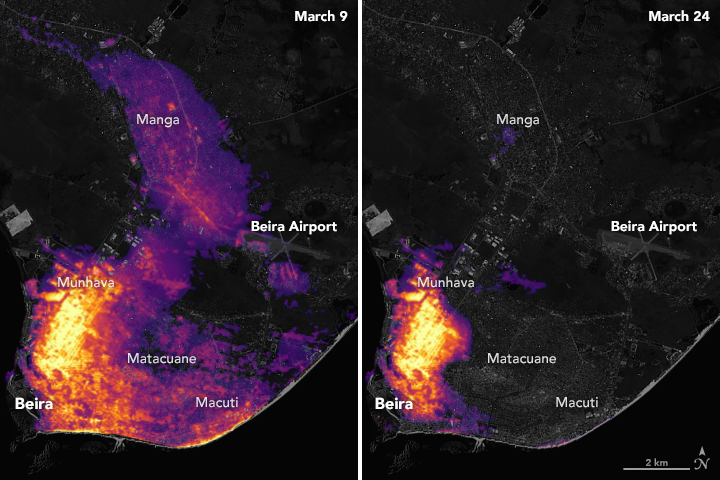
The image on the left shows the extent of electric lighting across Beira on March 9, 2019, a typical night before the storm hit; the image on the right shows light on March 24, 2019, three days after Idai had passed. Nearly all electricity and internet went out, except near the airport where relief organizations had set up a server.
These images of Beira’s nighttime lights are based on data captured by the Suomi NPP satellite. The data was acquired by the Visible Infrared Imaging Radiometer Suite (VIIRS) “day-night band,” which detects light in a range of wavelengths from green to near-infrared, including reflected moonlight, light from fires and oil wells, lightning, and emissions from cities or other human activity. A team of scientists from NASA’s Goddard Space Flight Center and Marshall Space Flight Center processed and corrected the raw VIIRS data to filter out stray light from sources that are not electric lights as well as other atmospheric interference, such as dust, haze, and thin clouds. The base map makes use of data collected by the Landsat satellite.
The cyclone also knocked out transmission lines in Mozambique that carry power to South Africa. The major state-owned utility company in South Africa has been administering controlled blackouts for more than a week to conserve energy until power lines are fixed, which may take weeks to months.
Idai dissipated on March 21, but had already dumped heavy rains on approximately 23,000 square kilometers (900 square miles) of land—an area larger than New York City and Los Angeles combined. In Mozambique, the storm inundated more than 360,000 hectares (900,000 acres) of crops, damaged at least 17,000 houses, and dozens of health units.
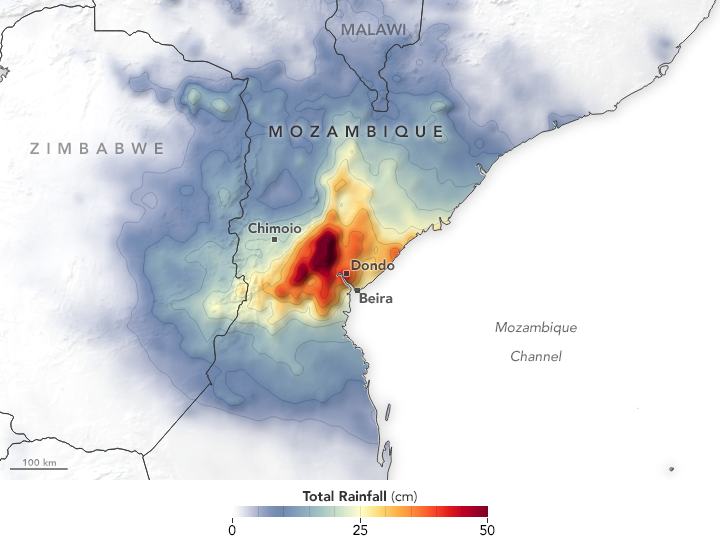
The map above shows rainfall accumulation from March 13 to March 20, 2019. Many areas received as much as 50 centimeters (20 inches) of rain. These data are remotely-sensed estimates that come from the Integrated Multi-Satellite Retrievals (IMERG), a product of the Global Precipitation Measurement (GPM) mission. Local rainfall amounts can be significantly higher when measured from the ground.
References and Further Reading
- American Red Cross (2019, March 19) Mozambique cyclone: “Almost everything is destroyed” Accessed March 27, 2019.
- Bloomberg (2019, March 20) Mozambique Power Links to South Africa May Take Weeks to Restore. Accessed March 27, 2019.
- CNN (2019, March 26) Dramatic drone footage reveals Cyclone Idai’s devastating power. Accessed March 26, 2018.
- NASA Earth Observatory (2019, March 22) Devastation in Mozambique.
- Nature (2019, March 26) Why Cyclone Idai is one of the Southern Hemisphere’s most devastating storms. Accessed March 27, 2019.
- The New York Times (2019, March 18) Cyclone Idai Destroys ‘Ninety Percent’ of a City of Half a Million in Southern Africa. Accessed March 26, 2019.
- Román, M.O. et al. (2019) Satellite-based assessment of electricity restoration efforts in Puerto Rico after Hurricane Maria. PLoS One, 14 (6).
- USAID (2019, March 22) Mozambique- Tropical Cyclone Idai- Fact Sheet #1 FY2019. Accessed March 27, 2019.
NASA Earth Observatory images by Joshua Stevens, using Black Marble data courtesy of Ranjay Shrestha/NASA Goddard Space Flight Center, Landsat data from the U.S. Geological Survey, and iMERG data from the Global Precipitation Mission (GPM) at NASA/GSFC. Story by Kasha Patel.
This image record originally appeared on the Earth Observatory. Click here to view the full, original record.
