ICESat-2 Sees the Trees in Mexico
Downloads
- mexico_ice2_2018292.png (720x740, PNG)
Metadata
- Sensor(s):
- Landsat 8 - OLI
- ICESat-2 - ATLAS
- Data Date: October 19, 2018
- Visualization Date: December 21, 2018
NASA’s Ice, Cloud and land Elevation Satellite-2 (ICESat-2) was launched in September 2018 and became the highest-resolution laser altimeter ever operated from space. The satellite is now measuring the height of Earth’s surfaces in remarkable detail. In this series, NASA Earth Observatory is sharing three early views that highlight the breadth of what ICESat-2 can “see”—from Antarctica’s icy terrain and sea ice to the forested landscape in Mexico.
The ICESat-2 satellite is already changing the way we look at Earth’s polar ice. But the satellite also collects detailed elevation measurements over tropical and temperate latitudes, providing a remarkable look at the heights of land and ocean features.
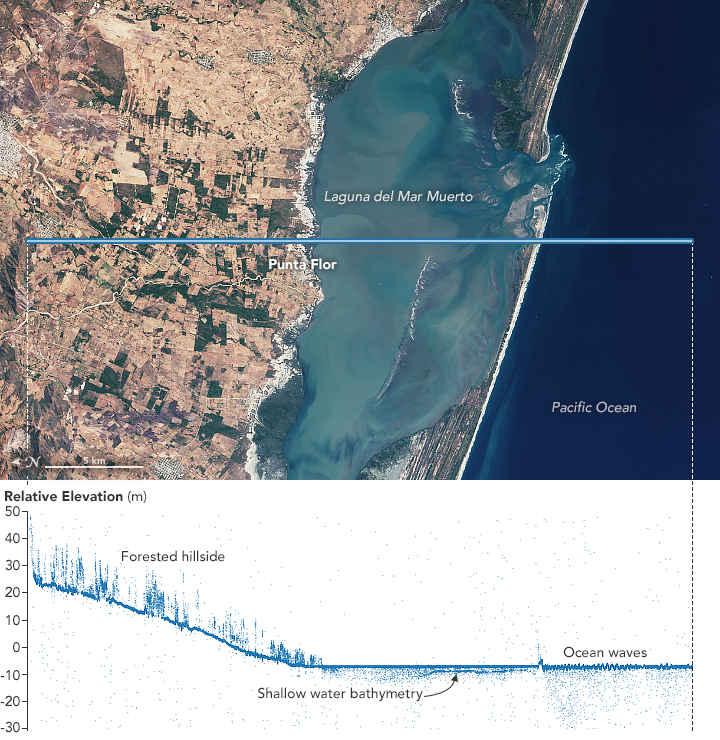
A forested hillside in Mexico is visible in the elevation measurement above, acquired on October 19, 2018, by the Advanced Topographic Laser Altimeter System (ATLAS) on ICESat-2. For reference, the orbital path is laid over a natural-color image acquired on January 11, 2017, by the Operational Land Imager (OLI) on Landsat 8.
ATLAS measures elevation by sending pulses of light to Earth’s surface. It then measures, to within a billionth of a second, how long it takes individual photons to return to the sensor. Each dot on the visualization above represents a photon detected by ATLAS. Most of the dots in this “photon cloud” are clustered around a surface, whether that’s a tree top, the ground, or waves in the ocean.
Along this orbital path from north to south (left to right) you first see a vegetated hillside sloping down toward the coastline. ICESat-2 can distinguish not only the tops of trees but also the inner canopies and the forest floor. Eventually, tree height data collected globally will improve estimates of how much carbon is stored in forests.
As the path continues past the coastline, photons returned from the seafloor become visible. Bathymetry measurements like this are possible in clear coastal areas, sometimes as deep as 80 feet (25 meters). According to Lori Magruder, a research scientist at the University of Texas and the ICESat-2 science team lead, the measurements could help with storm surge modeling. “Seeing such extensive bathymetry was a pleasant surprise,” she said. “We didn’t anticipate that.”
Finally, as the path moves beyond Laguna del Mar Muerto and over the Pacific Ocean, the surface of the water is visibly rougher and the photons trace the height of individual waves. With this kind of information, scientists can start to look at things like the frequency of surface waves and their structure.
“We were all taken aback seeing the amazing detail from ICESat-2,” Magruder said. “On every surface, there was some amazing feature that we weren’t used to getting from the first ICESat.”
References
- NASA (2018, December 11) ICESat-2 Reveals Profile of Ice Sheets, Sea Ice, Forests. Accessed December 11, 2018.
- NASA (2018) ICESat-2. Accessed December 10, 2018.
- NASA Earth Observatory (2018, December 18) Thick and Thin Ice in the Weddell Sea.
- NASA Earth Observatory (2018, December 12) Taking Measure of Antarctic Terrain.
- NASA Earth Observatory (2018, September 17) Mission to Track Earth’s Changing Ice Launches.
NASA Earth Observatory image by Joshua Stevens, using ICESat-2 data courtesy of Amy Neuenschwander (University of Texas) and Kaitlin Harbeck (NASA Goddard Space Flight Center), and Landsat data from the U.S. Geological Survey. Story by Kathryn Hansen with materials from Kate Ramsayer.
This image record originally appeared on the Earth Observatory. Click here to view the full, original record.