Rainy October Soaks Texas
Downloads
- texas_oli_2016284_lrg.jpg (5784x2956, JPEG)
- texas_oli_2018305_lrg.jpg (5784x2956, JPEG)
- texas_mrg_2018304._lrg.png (1639x1267, PNG)
Metadata
- Sensor(s):
- Landsat 8 - OLI
- Data Date: October 1, 2018 - November 1, 2018
- Visualization Date: November 2, 2018
After making landfall in northwestern Mexico, Hurricane Willa quickly weakened over rugged, dry terrain. But the remnants of that category 3 storm pushed a stream of moisture and rain northeast toward Texas.
While Willa did not bring overwhelming rain to Texas, the infusion of moisture was unwelcome in a state already in the grips of severe flooding. Since September 2018, a series of storms have delivered historic amounts of rain to central Texas. One particularly potent cold front in mid-October dropped more than a foot of rain in some areas.
The deluge saturated soils, overfilled lakes and reservoirs, and pushed rivers over their banks. One river even flowed backwards. In a series of proclamations issued throughout October, the Texas governor declared a state of disaster for 111 counties because of the flooding and severe weather.
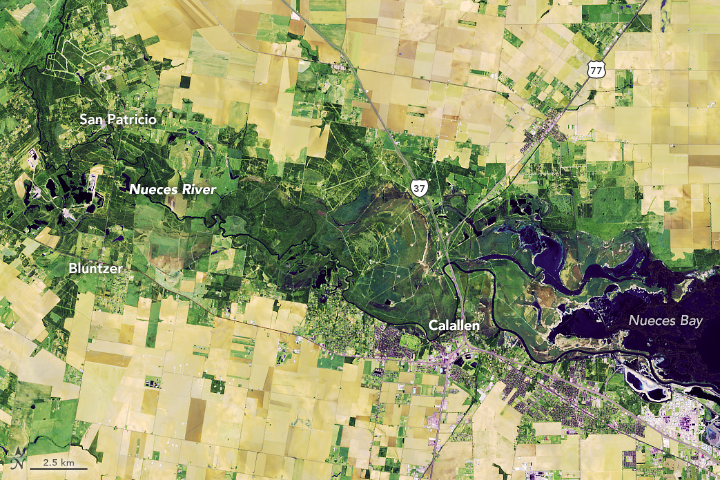
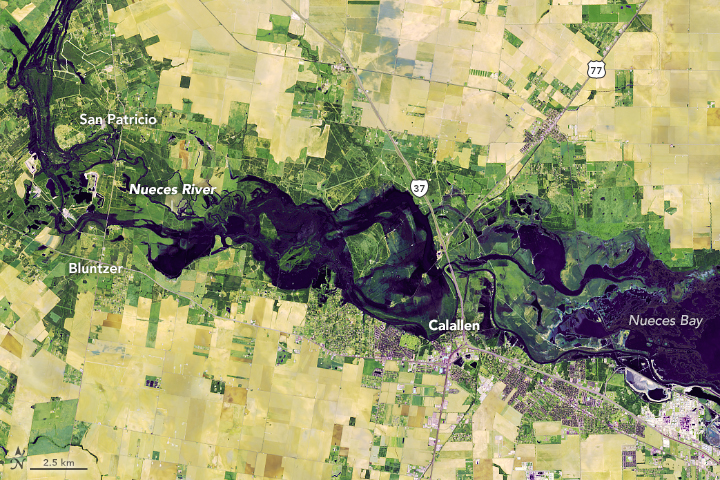
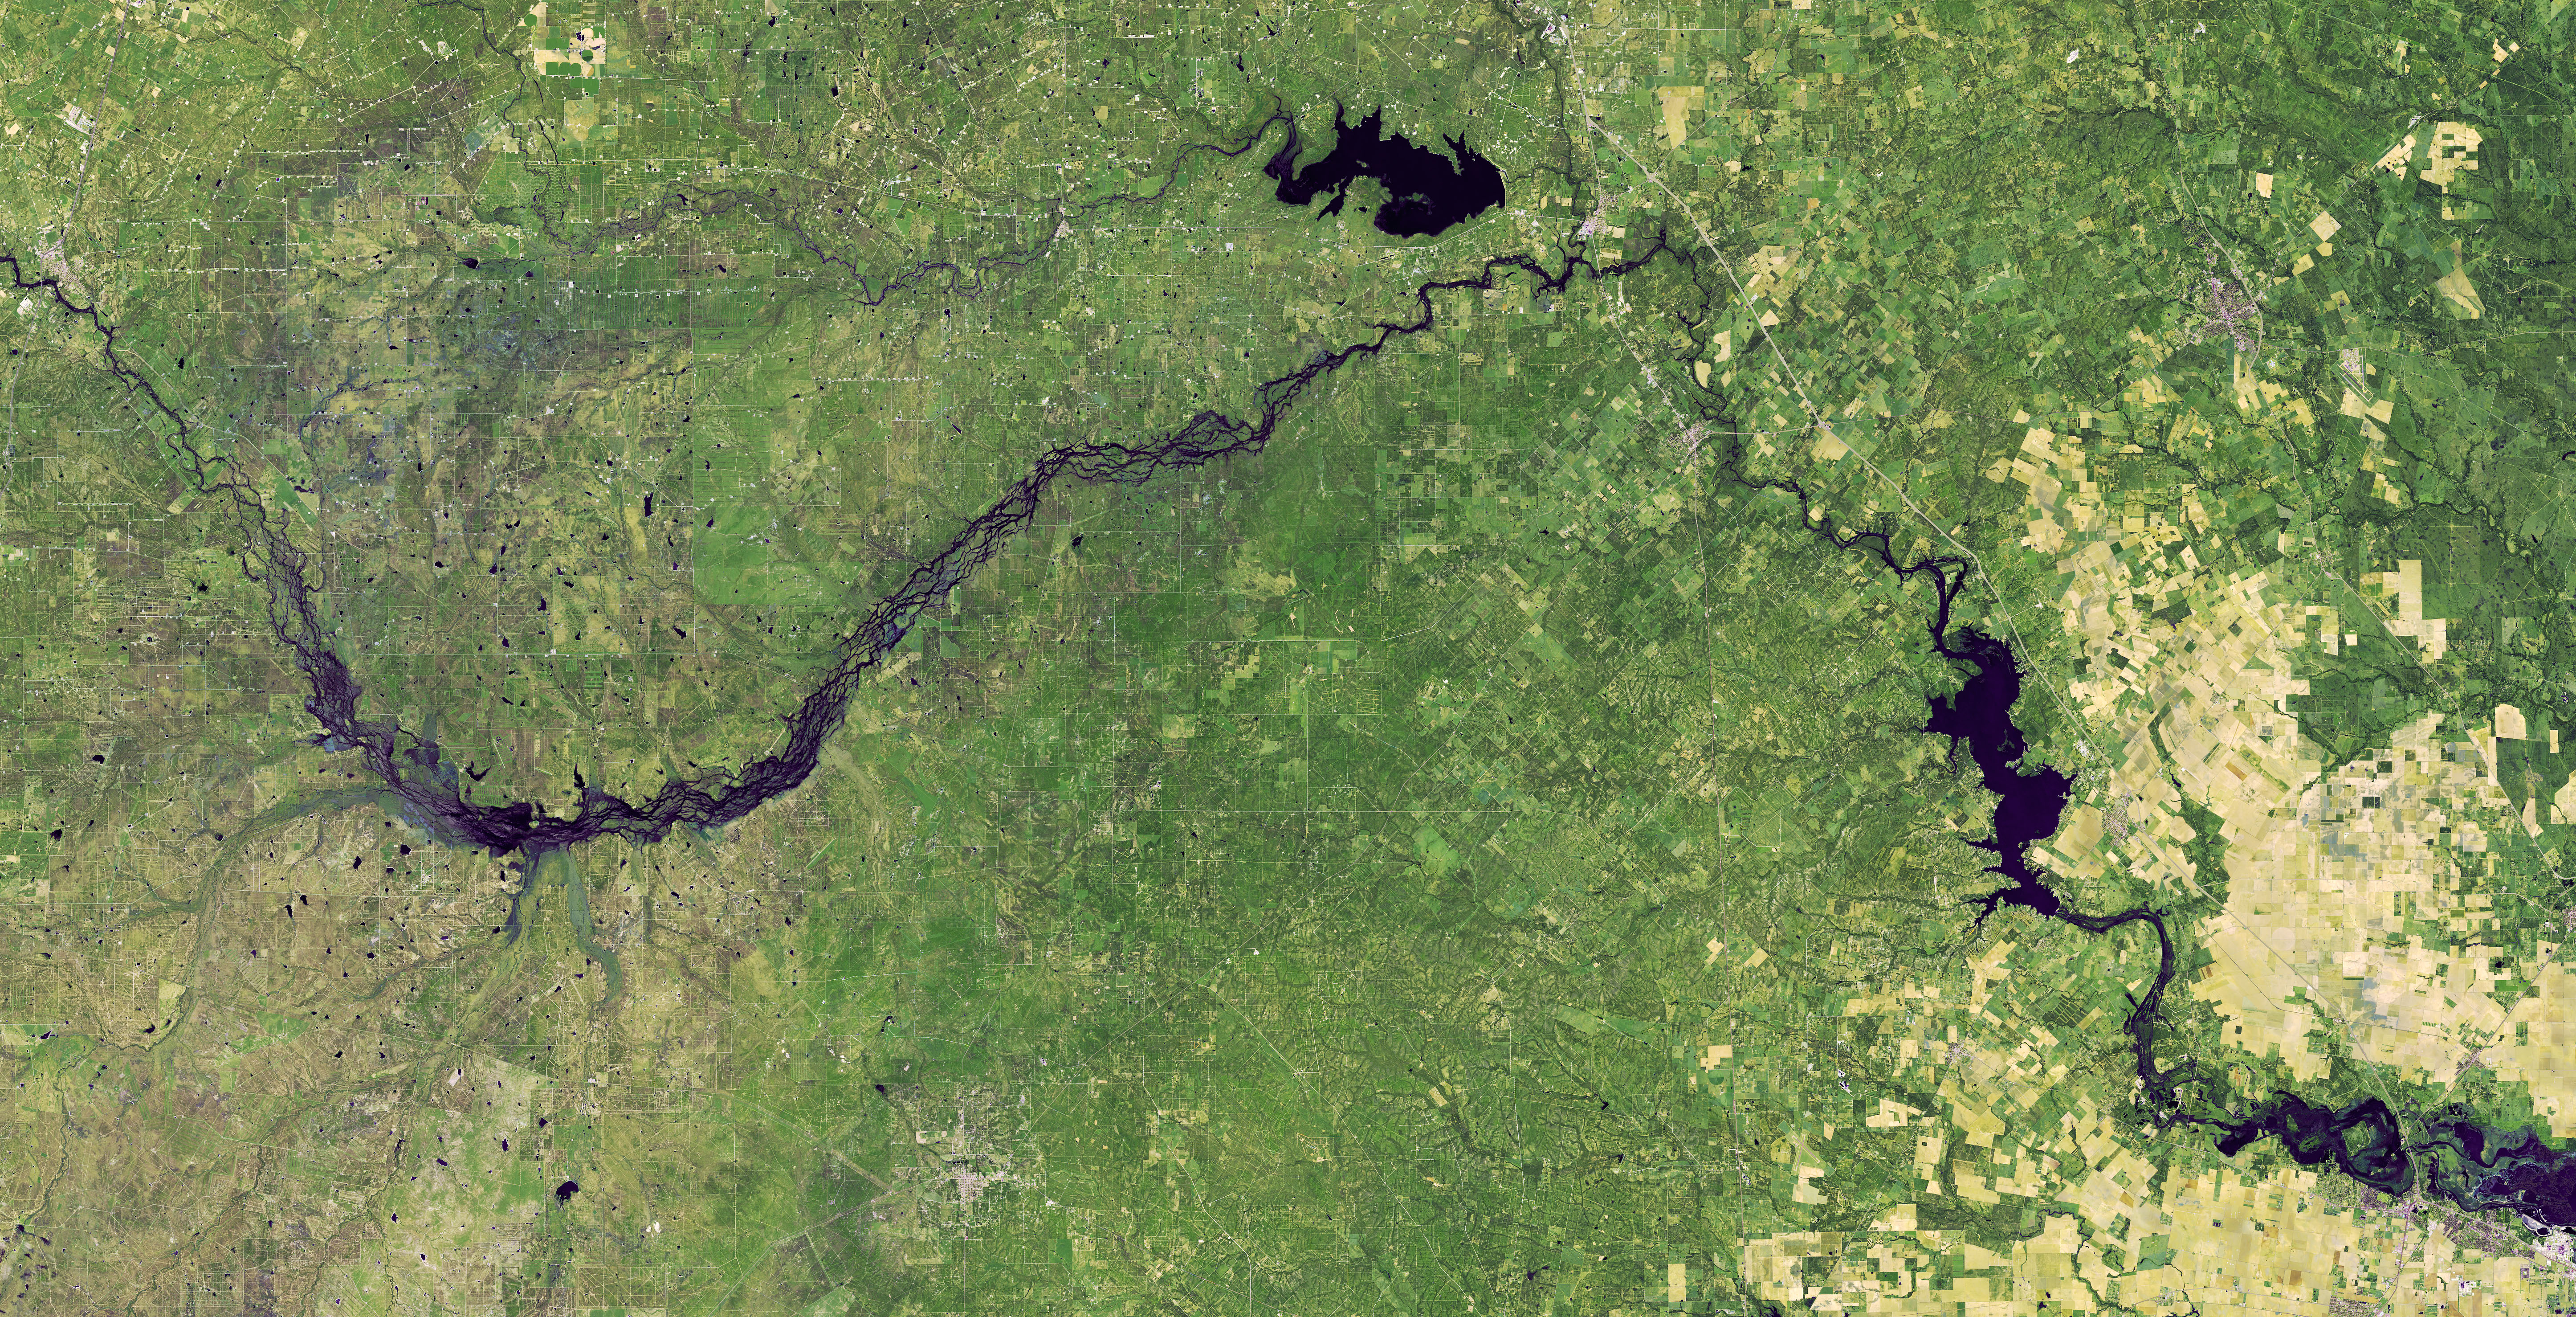
Several satellites observed the deluge and its aftermath. On November 1, 2018, the Operational Land Imager (OLI) on Landsat 8 captured a false-color view (bands 7-6-4) of flooding along the Nueces River near Calallen. At the time, a stream gauge in nearby Mathis showed the river had risen to 9 meters (28 feet), putting it 1 meter (3 feet) above flood stage. As noted by University of Wisconsin-Madison meteorologist Scott Bachmeier, multiple satellites captured images showing a pulse of flood water making its way down the Nueces River on October 27-28, 2018.
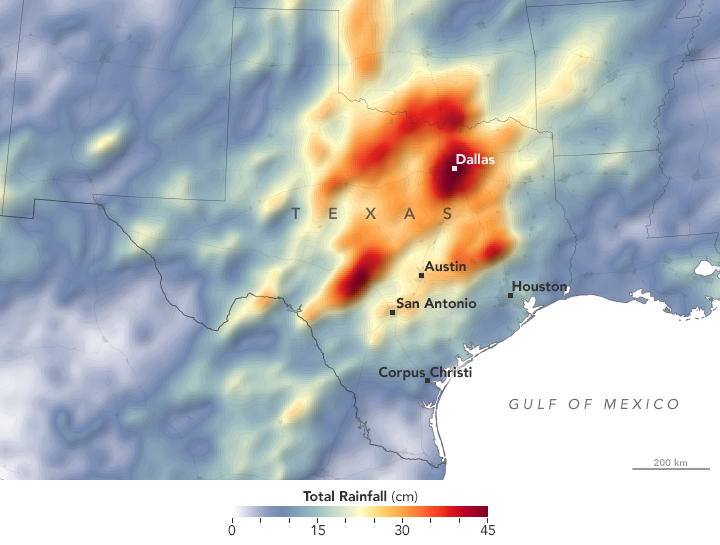
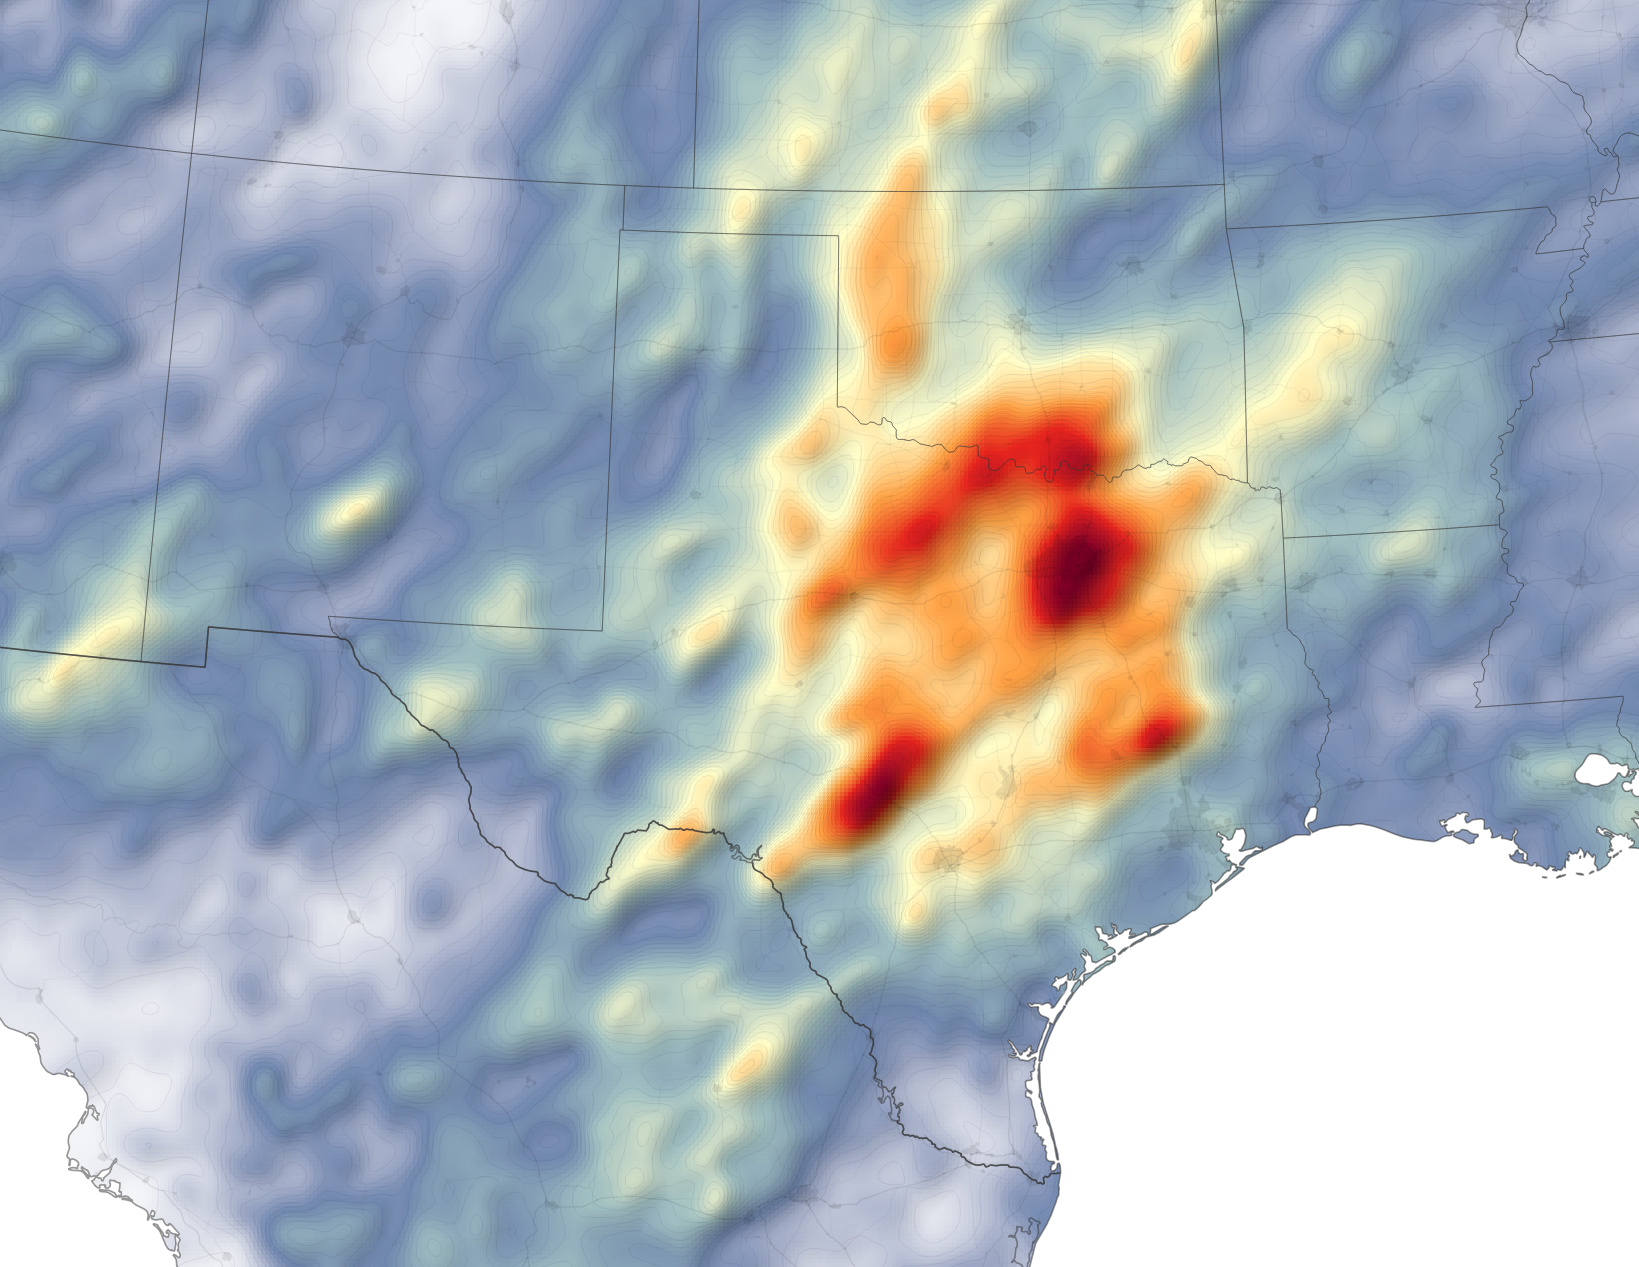
The map depicts satellite-based measurements of rainfall from October 1 to October 31, 2018. The brightest areas reflect the highest rainfall amounts, with many places receiving 25 to 45 centimeters (10 to 17 inches) or more during this period. The measurements are a product of the Global Precipitation Measurement (GPM) mission, which is a partnership between NASA, the Japan Aerospace Exploration Agency, and five other national and international partners.
These rainfall totals are regional, remotely-sensed estimates. Each pixel shows 0.1 degrees of the globe (about 11 kilometers at the equator), and the data are averaged across each pixel. Therefore, individual ground-based measurements within a pixel can be significantly higher or lower than the satellite average.
Dallas Fort Worth Airport recorded 39.77 centimeters (15.66 inches) of rain in October 2018, making it the wettest October on record there, according to the National Weather Service. While the statistics are still being finalized statewide, it is likely that October will go down as the second wettest month in Texas on record.
References
- Caller Times (2018, October 31) Corpus Christi officials expect more flooding along Nueces River. Accessed November 2, 2018. ? Herald Democrat (2018, November 1) October among wettest months in Texas history. Accessed November 2, 2018.
- Star-Telegram (2018, October 25) October set a new rainfall record. Could we break the record for wettest year? Accessed November 2, 2018.
- The Dallas Morning News (2018, September 22) Wet September shatters 86-year Dallas record, and there's more rain in forecast. Accessed November 2, 2018.
- Texas Storm Chasers (2018, October 23) Widespread rain chances tonight through Thursday morning. Accessed November 2, 2018. ?
- Texas Storm Chasers (2018, October 18) More rain means new flooding beginning tonight through Friday evening. Accessed November 2, 2018.
- The Washington Post (2018, October 16) Severe flooding in central Texas causes bridge to collapse and at least one death. Accessed November 2, 2018.
- The Weather Channel (2018, October 19) Lake Travis Still Rising as 'Historic Flooding' Continues in Texas Highland Lakes. Accessed November 2, 2018.
- US National Weather Service Corpus Christi Texas (2018, October 30) Important Thread Regarding the Major Flooding on the Nueces River. Accessed November 2, 2018.
NASA Earth Observatory images by Joshua Stevens, using Landsat data from the U.S. Geological Survey and IMERG data from the Global Precipitation Mission (GPM) at NASA/GSFC. Story by Adam Voiland.
This image record originally appeared on the Earth Observatory. Click here to view the full, original record.