Wasting Away (Again) in Greenland
Downloads
- frederikshab_oli_2023165_lrg.jpg (3384x2256, JPEG)
- frederikshab_oli2_2023205_lrg.jpg (3384x2256, JPEG)
- meltpond_oli2_2023189_lrg.jpg (2702x1801, JPEG)
Metadata
- Sensor(s):
- Landsat 8 - OLI
- Landsat 9 - OLI-2
- Data Date: June 14, 2023 - July 24, 2023
- Visualization Date: July 28, 2023
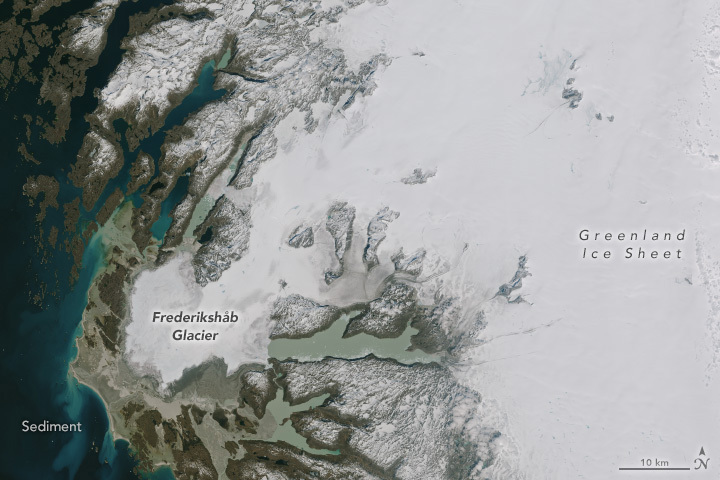
More than halfway through the 2023 melting season, Greenland has seen a substantial transformation of its snow cover. Melting has been above average for much of the season, including on several days in June and July when melt was detected across 800,000 square kilometers (302,000 square miles)—up to 50 percent—of Greenland Ice Sheet’s surface, according to the National Snow and Ice Data Center.
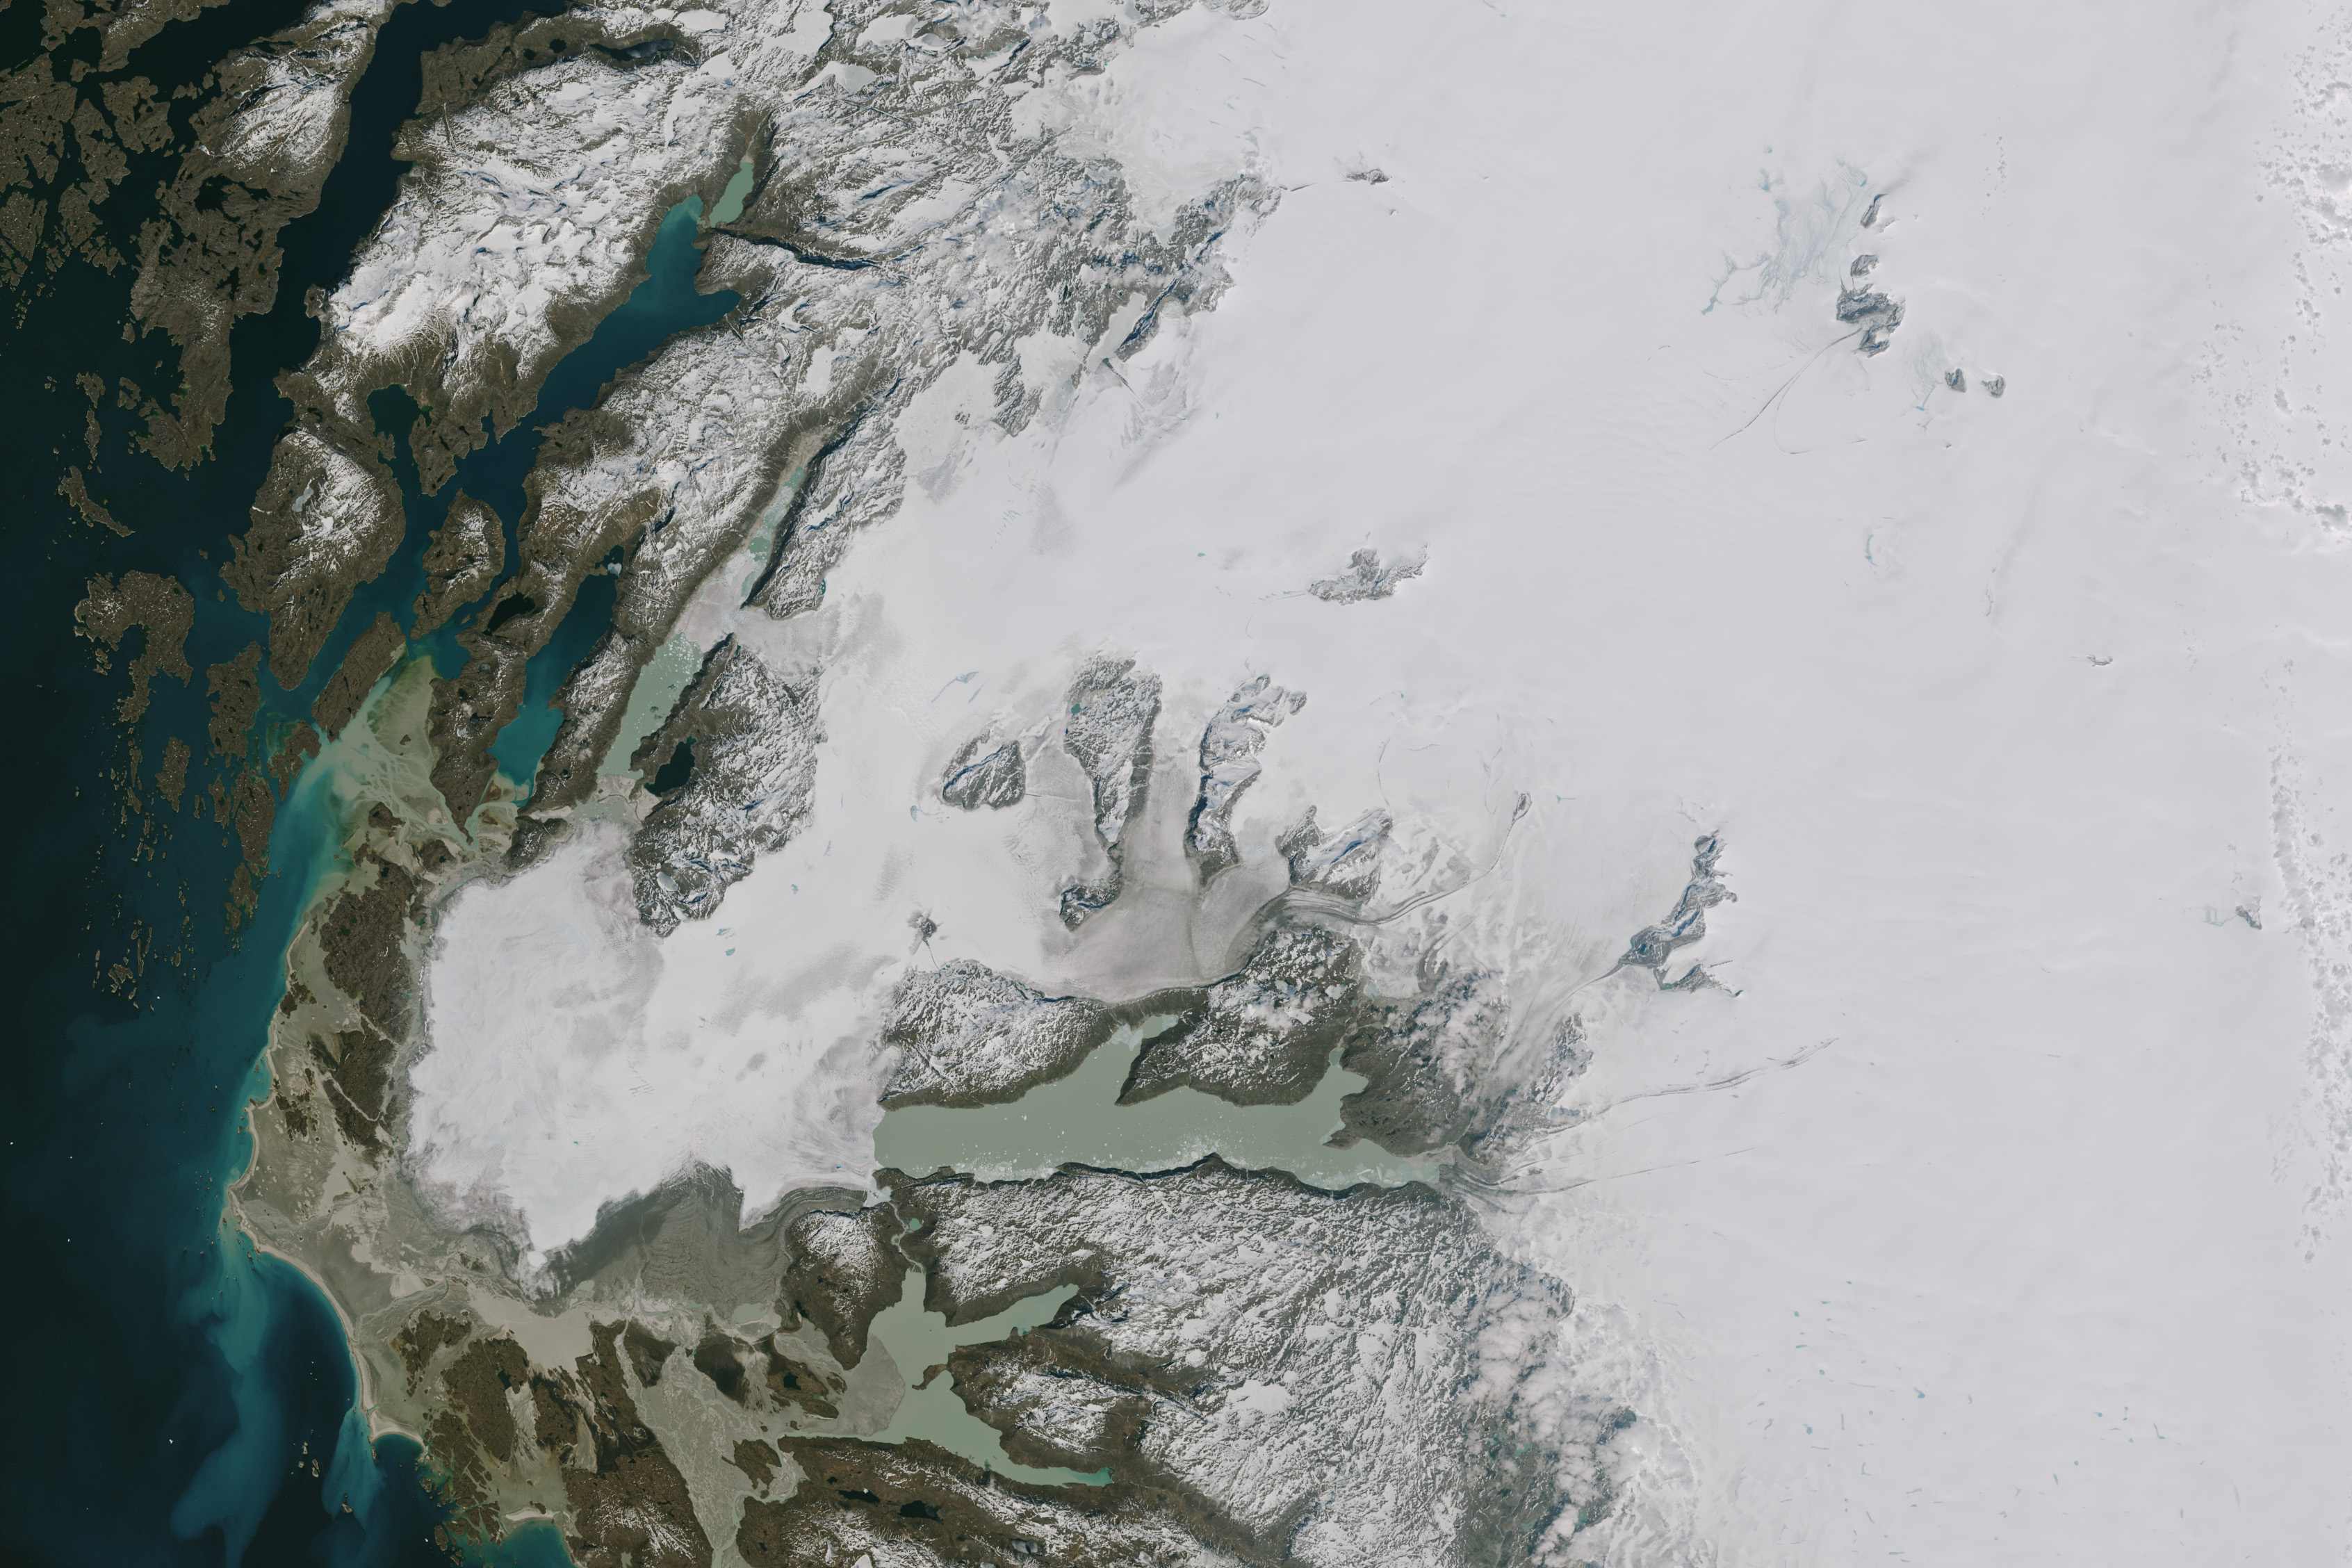
Summer melting was ramping up on June 14, 2023, when the Operational Land Imager (OLI) on Landsat 8 acquired this image (left) of Frederikshåb Glacier. This lobe-shaped piedmont glacier, located in southwest Greenland, flows downward from the Greenland Ice Sheet, winds past a series of valleys and nunataks, then flattens out on smoother terrain along the coast.
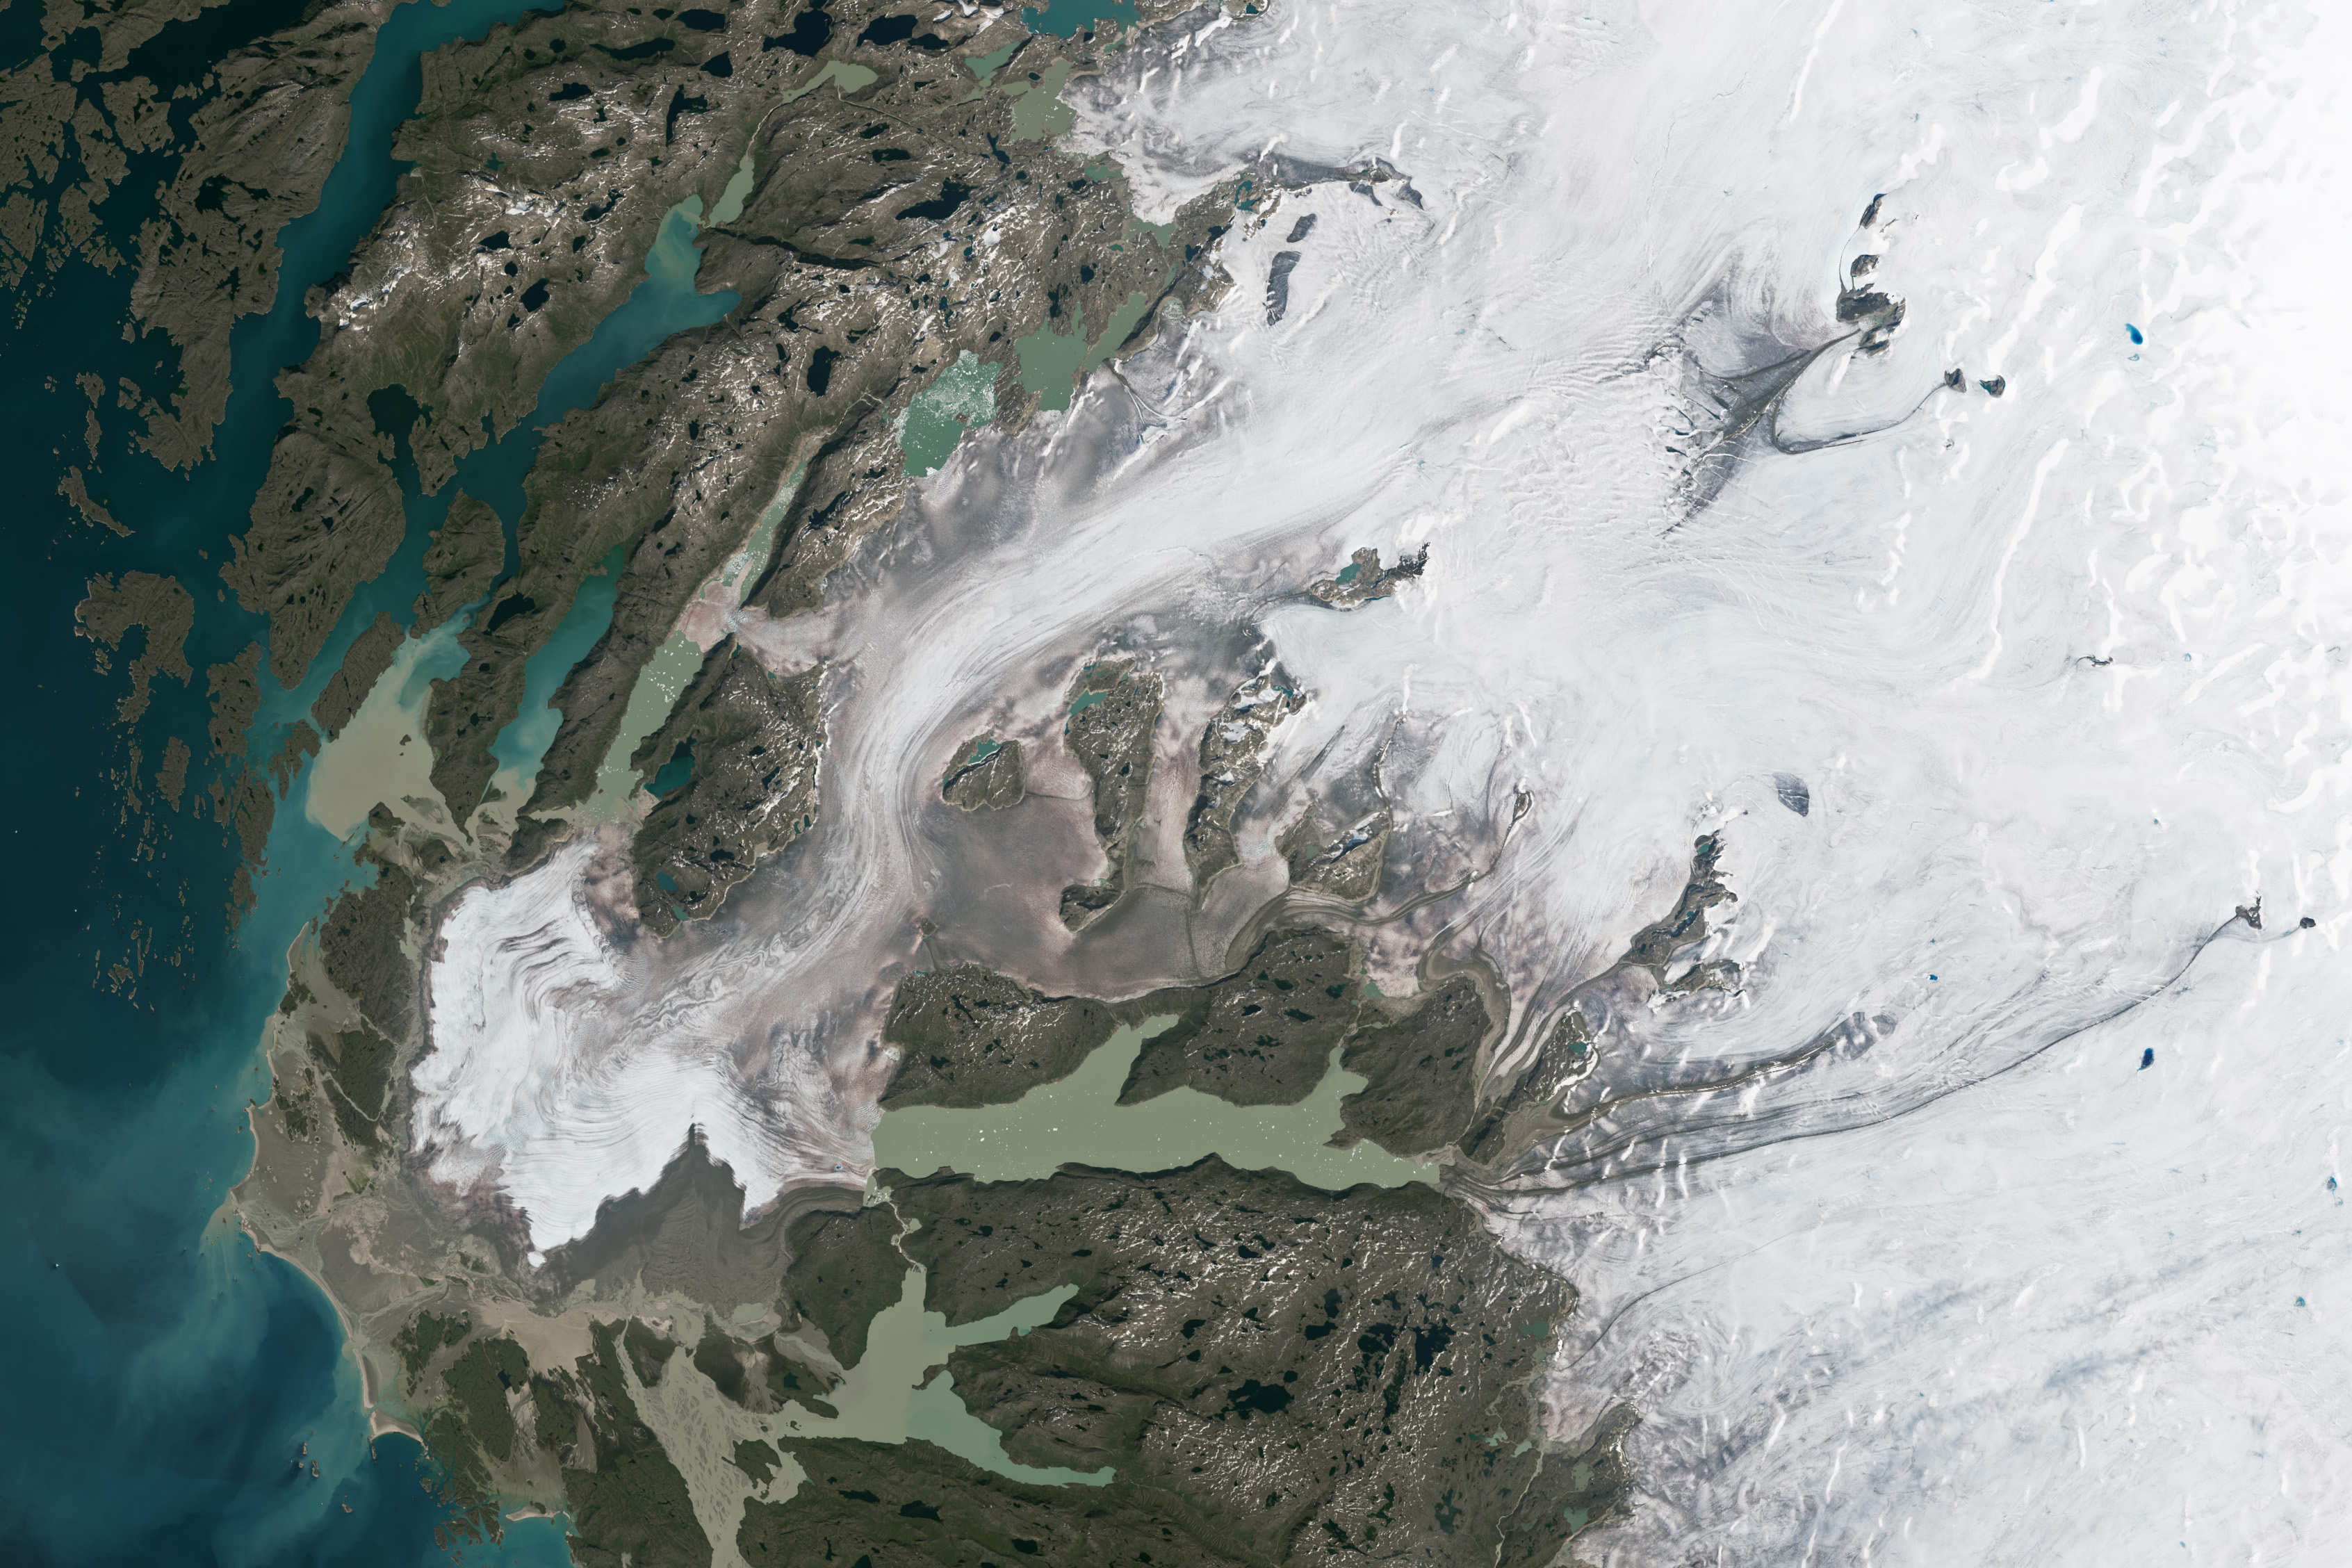
The other image (right), acquired with the OLI-2 on Landsat 9, shows the same area on July 24, after more than a month of additional melting. Notice the dramatic reduction in the extent of brighter (high albedo) surface snow.
Since September 2021, when Landsat 9 joined Landsat 8 in orbit over Earth, scientists have been getting more frequent detailed views of Earth. The Landsat 8 and Landsat 9 satellites together acquire about 1,500 scenes from across the planet every day. That comes in handy for observing the planet’s icy regions, where seasonal changes can be quick and dramatic.
Another seasonal change visible in the image pair above is the transition from “clean” snow to “dirty” ice. One reason for the darker color is due to the presence of particles, such as black carbon or dust, that have accumulated on the ice. As the snow and ice melt, these impurities are left behind. Darkening of the ice surface lowers its albedo, which can hasten melting through the absorption of additional solar energy in the summer months.
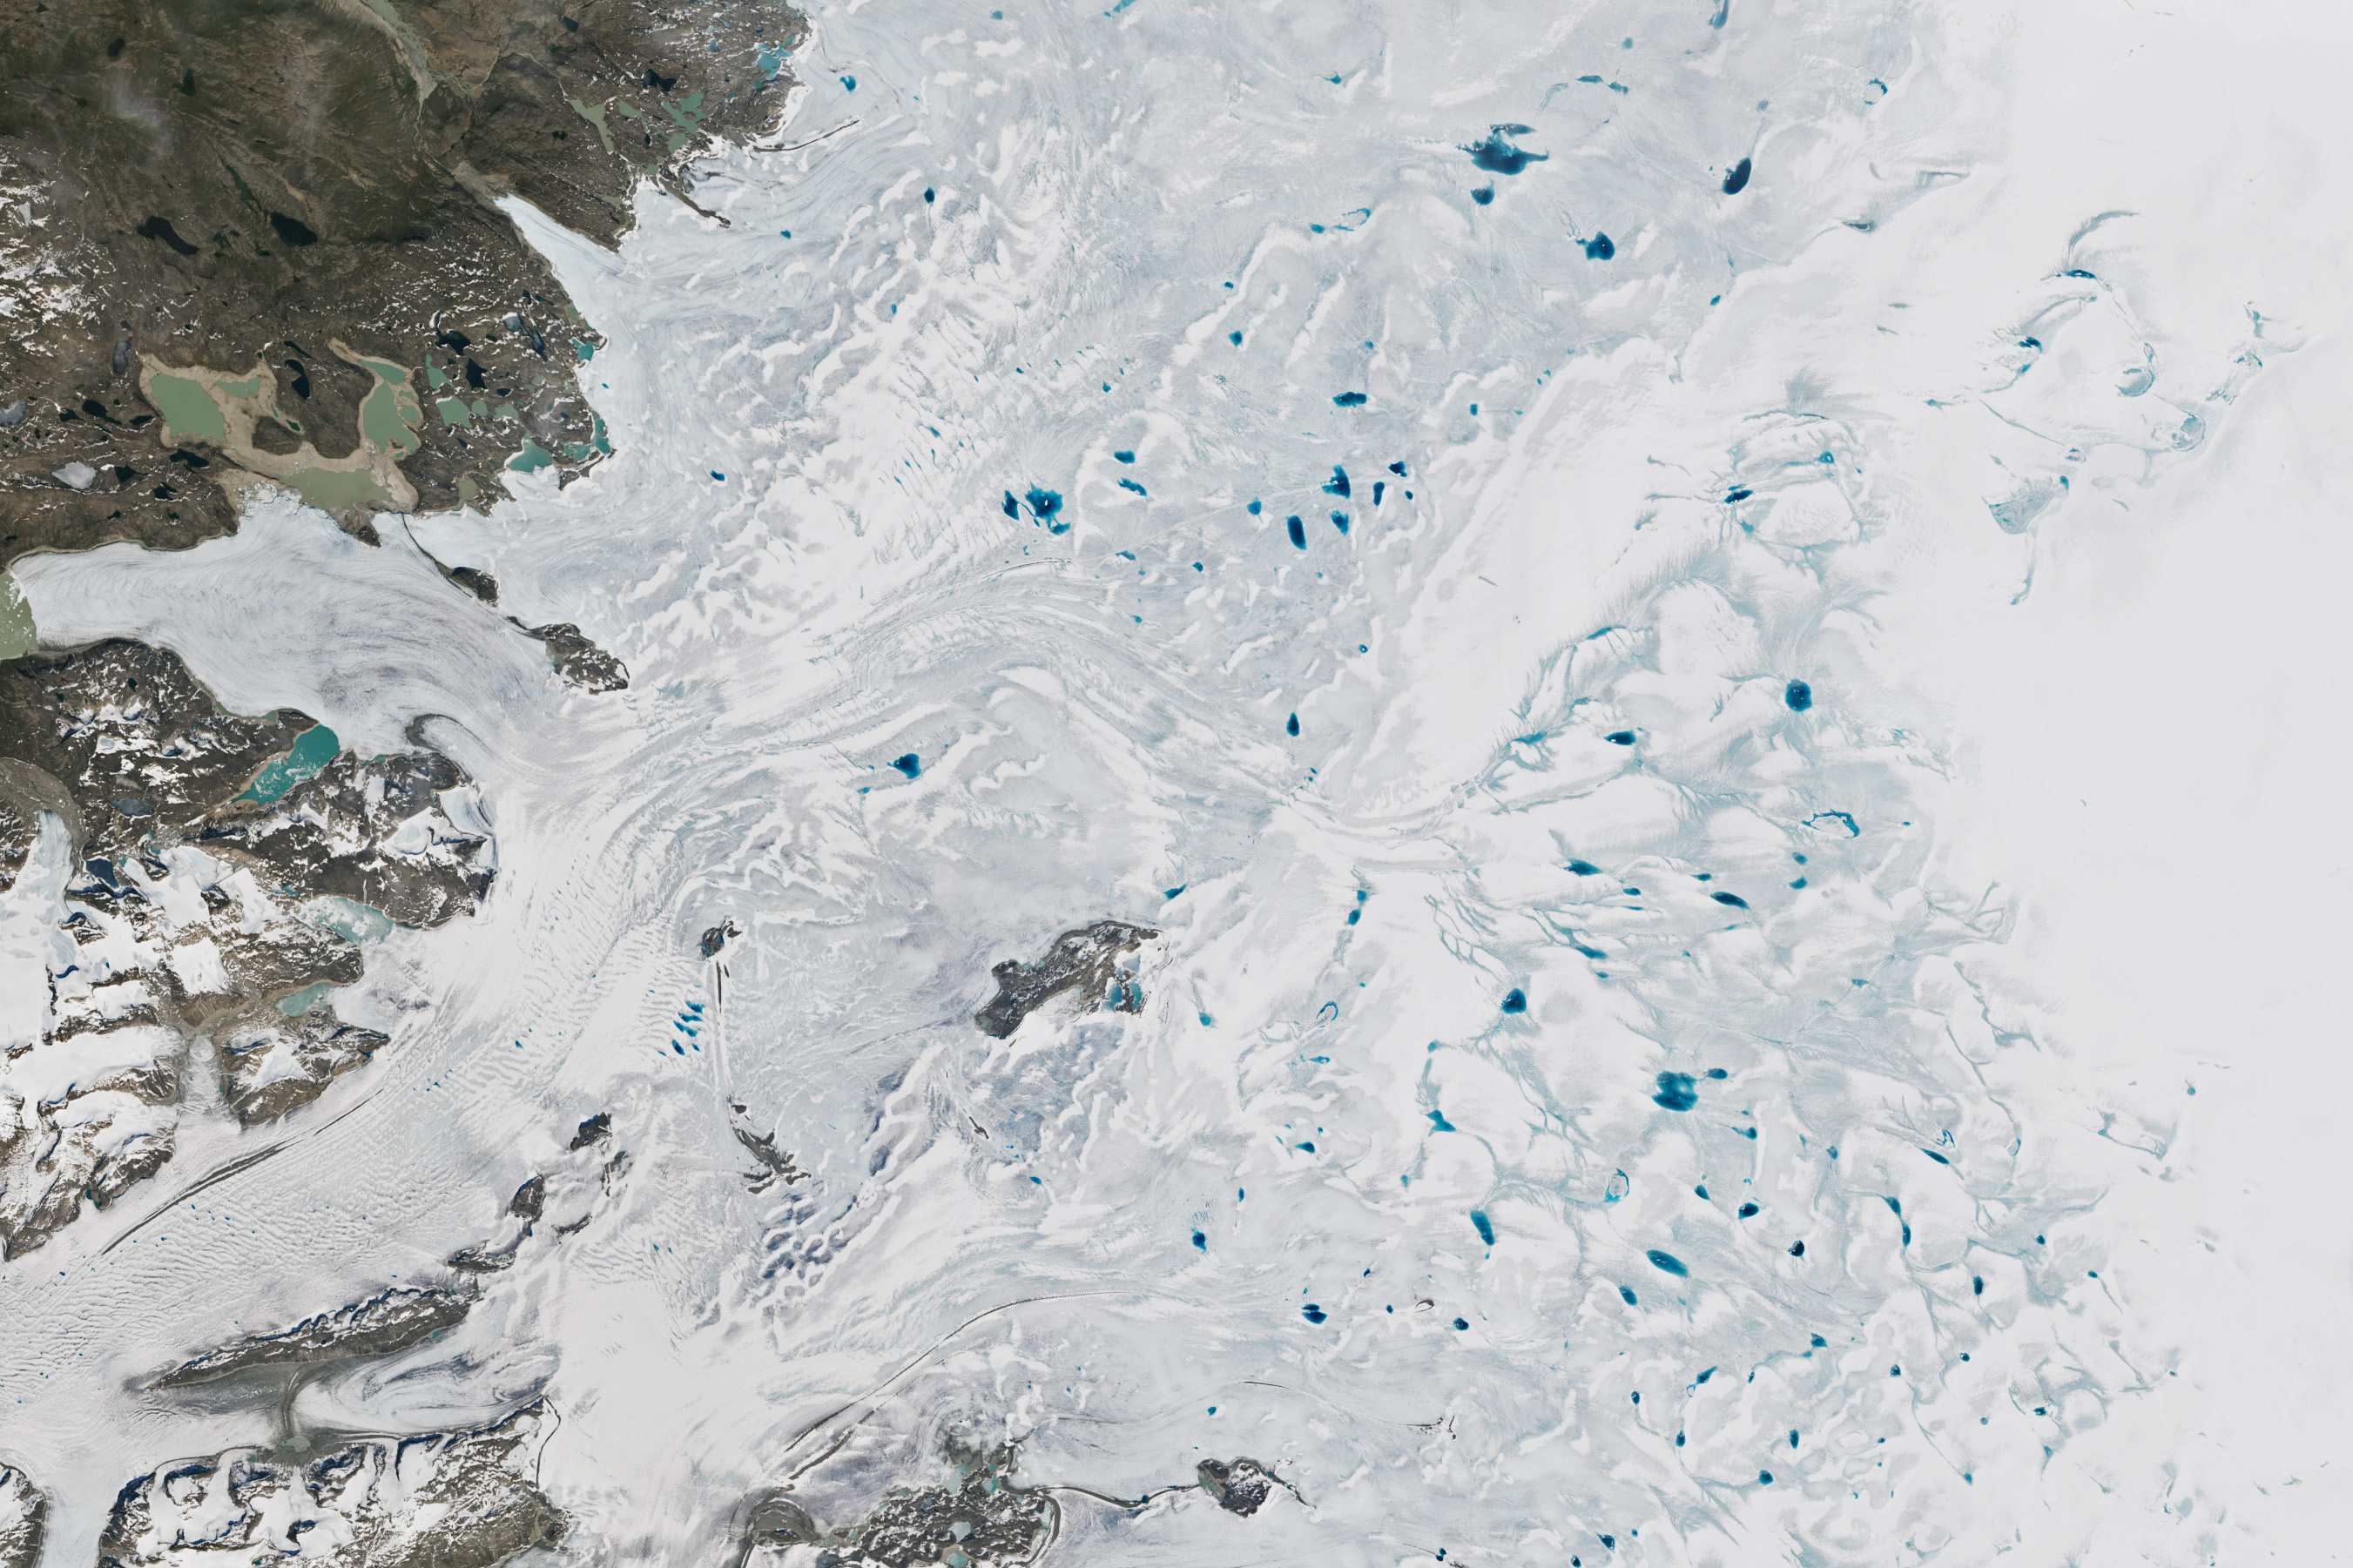
Another change is in the presence of ponded water, or “melt ponds,” on the surface of the ice sheet. Deep blue in color, they form where snow has melted and pooled in low spots on the ice sheet’s undulating topography. They can be an important indicator of the strength of Greenland’s melting season, which generally runs from May to early September.
Only a few melt ponds are visible in the July 24 image (top-right), possibly because meltwater had already run off the ice sheet or been channeled down through the ice. However, abundant melt ponds were visible about 100 kilometers (60 miles) north of Frederikshåb on July 8, when the OLI-2 on Landsat 9 acquired the image above.
The changes are the result of the increasing warmth of summer weather that took hold across the region in late June. That’s when warm southwesterly winds and clear skies significantly enhanced the amount of melting on the ice sheet, especially toward the island’s south.
So far in Greenland’s 2023 melting season, spikes in daily melt area have stayed below those of 2012, a year with exceptionally widespread melting. Still, as of mid-July, daily melt extents have been consistently higher than the 1981-2010 average, and 2023 is on par with several other high melt years in recent decades.
“The drama of unprecedented melt in 2012 may not be exceeded this year,” said Christopher Shuman, a University of Maryland, Baltimore County, glaciologist based at NASA’s Goddard Space Flight Center. “But so far, 2023 looks to be a big, broad melt year.”
References
- Naegeli, K. and Huss, M. (2017) Sensitivity of mountain glacier mass balance to changes in bare-ice albedo. Annals of Glaciology, 58 (75pt2).
- NASA Earth Observatory (2021, November 29) Silting the Cold Sea. Accessed July 28, 2023.
- NSIDC Ice Sheets. Accessed July 28, 2023.
- NSIDC, Greenland Ice Sheet Today (2023, July 19) Sudden shift to southern heat. Accessed July 28, 2023.
- Ryan, J.C. et al. (2018) Dark zone of the Greenland Ice Sheet controlled by distributed biologically-active impurities. Nature Communications, 9, 1065.
NASA Earth Observatory images by Wanmei Liang, using Landsat data from the U.S. Geological Survey. Story by Kathryn Hansen.
This image record originally appeared on the Earth Observatory. Click here to view the full, original record.